Figure 1. GluA1-4 expression in cultured cortical neurons visualized using HB7534.
HB7534 stains AMPA receptors in a cultured rat cortical neuron using HB6581 (chicken polyclonal anti-MAP2 antibody) counterstain. Method: neurones were cultured from E17-E18 rat embryos following established protocols (Martin and Henley, 2004. EMBO, 4749–4759) and fixed with 4% PFA on DIV21. Antigen retrieval was carried out by heating the coverslip to 95°C in 100mM Tris, 5% urea, pH9.5. Following washes, cells were permeabilised with 0.1% Triton X-100 followed by blocking in 1% BSA, 300mM glycine. HB7534 (rabbit polyclonal anti-GluA1-4) and HB6581 (chicken polyclonal anti-MAP2) antibodies were incubated overnight (4°C) at a 1:1,000 dilution. This was followed by a one-hour incubation with secondary antibodies (Polyclonal goat anti-chicken Alexa Fluor 488 conjugated, 1:300 dilution and polyclonal goat anti-rabbit DyLight 650 conjugated, 1:300 dilution). DAPI (HB0747) was used at 1µg/ml to visualise cell nuclei. For more detail please see our ICC protocol. Images were captured using a Leica SP8 AOBS confocal laser scanning microscope attached to a Leica DM I8 inverted epifluorescence microscope. The image was captured in Lightning deconvolution mode using a 40x objective (1.28x zoom), 405nm (11.1% power, PMT: 717V gain), 488nm (1% power, Hyd: 10% gain), 561nm (1% power, HyD: 10% gain) and 633nm (5% power, Hyd: 54.1% gain) laser lines in a z-stack (0.44µm spacing). The stack was flattened using a maximum Z projection in ImageJ (Schindelin et al., 2012. Nat Methods, 9(7), 676–682).
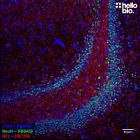
Figure 2. AMPA receptor expression in rat dentate gyrus and CA1 mapped using HB7534.
HB7534 labels the dense expression of AMPA receptors in the dentate gyrus and CA1. Method: Rat brains were dissected and fixed overnight in 4% PFA before then being incubated in 30% sucrose (in PBS) until sunk (approx. 48hrs). A freezing microtome was used to cut 40µm horizontal slices. Citrate antigen retrieval was carried out through incubation of sections with 10mM citric acid, 0.05% Tween 20, pH6 at 95°C for 30 minutes followed by a 20-minute cooling period. Sections were then blocked in 0.05M glycine, 2% BSA and 3% goat serum before incubation overnight in HB7534 (1:250 dilution) and HB6429 (mouse monoclonal anti-NeuN, 1:1,000 dilution, 1µg/ml). This was followed by a two-hour incubation with secondary antibodies at a 1:300 dilution (polyclonal goat anti-mouse DyLight 488 and goat anti-rabbit DyLight 650). DAPI (HB0747) was used at 1µg/ml to visualise cell nuclei. For more detail please see our IHC(IF) protocol. Images were captured as a tilescan using a Leica DMI6000B inverted epifluorescence microscope. The image was captured using a 10x objective in a z-stack (9.6µm spacing). The image was captured using DAP (24ms exposure), L5 (200ms exposure) and Y5 (300ms exposure) filters. The stack was deconvolved using Huygens professional then flattened using a maximum Z projection in ImageJ (Schindelin et al., 2012. Nat Methods, 9(7), 676–682).
Figure 3. GluA1-4 and GluN1 colocalization in cultured cortical neurons visualized using HB7534 and HB7535.
HB7534 and HB7535 stain AMPA and GluN1 receptors respectively in a cultured rat cortical neuron preparation using HB6581 (chicken polyclonal anti-MAP2 antibody) counterstain. Method: neurones were cultured from E17-E18 rat embryos following established protocols (Martin and Henley, 2004. EMBO, 4749–4759) and fixed with 4% PFA on DIV21. Antigen retrieval was carried out by heating the coverslip to 95°C in 100mM Tris, 5% urea, pH9.5. Following washes, cells were permeabilised with 0.1% Triton X-100 followed by blocking in 1% BSA, 300mM glycine. HB7534 (rabbit polyclonal anti-GluA1-4), HB7535 (mouse monoclonal anti-GluN1) and HB6581 (chicken polyclonal anti-MAP2) antibodies were all incubated overnight (4°C) at a 1:1,000 dilution. This was followed by a one-hour incubation with secondary antibodies (Polyclonal goat anti-chicken Alexa Fluor 488 conjugated, 1:300 dilution, polyclonal goat anti-mouse DyLight 550 conjugated, 1:300 dilution and polyclonal goat anti-rabbit DyLight 650 conjugated, 1:300 dilution). DAPI (HB0747) was used at 1µg/ml to visualise cell nuclei. For more detail please see our ICC protocol. Images were captured using a Leica SP8 AOBS confocal laser scanning microscope attached to a Leica DM I8 inverted epifluorescence microscope. The image was captured in Lightning deconvolution mode using a 63x objective (2.01x zoom), 405nm (11.1% power, PMT: 673V gain), 488nm (1% power, Hyd: 10% gain), 561nm (1% power, HyD: 10% gain) and 633nm (5% power, Hyd: 18.6% gain) laser lines in a z-stack (0.38µm spacing). The stack was flattened using a maximum Z projection in ImageJ (Schindelin et al., 2012. Nat Methods, 9(7), 676–682).
Figure 4. GluA1-4 expression in various tissue lysates and preparations.
HB7534 revealed the ≈108kDa band associated with GluA1-4 in brain membrane fractions with evidence for an internalised degradation fragment weighing ≈51kDa in brain cytosol fractions. Method: mouse brain and rat brain membrane (P2) and cytosol fractions were prepared following previous work (Molnar et al., 1993. Neuroscience 53:307-326) from freshly collected adult brains. Other tissue lysates were prepared following established protocols from freshly dissected tissue (see our guide on WB sample preparation). Samples were loaded (20µg / lane) onto a 4-20% acrylamide gel alongside a protein ladder before being run at 150V for 45 minutes. Wet transfer to a PVDF membrane was completed in 90 minutes using 400mA. The membrane was blocked for 2hrs in 5% non-fat dry milk before being incubated overnight at 4°C in HB7534 at a 1:2,000 dilution. Following washing, the membrane was incubated in secondary antibody (1:20,000 dilution, Polyclonal goat anti-rabbit HRP conjugated, HB9524) for 2hrs. For more detail please see our Western blotting protocol. Detection was accomplished using Clarity Western ECL substrate (BioRad, 1705061) and a Licor Odyssey Fc imaging system (ECL channel: 8 min exposure, 700nm channel: 30 sec exposure). Following imaging the membrane was stripped with HB7756 stripping buffer before being washed, blocked for 2 hours in 5% non-fat dry milk and incubated in HB9177 (mouse monoclonal anti-GAPDH, 1:4,000 dilution, 0.25µg/ml) overnight at 4°C. Following washing the membrane was incubated in a 1:10,000 dilution of polyclonal goat anti-mouse HRP conjugated secondary antibody (HB8356) for 2hrs and visualised again using Clarity Western ECL substrate and a Licor Odyssey Fc imaging system (ECL channel: 4 min exposure, 700nm channel: 30 sec exposure).
Figure 5. Concentration response of HB7534 staining in rat hippocampus.
HB7534 concentration response in rat hippocampus shows optimal labelling at a 1:250 dilution. Method: Rat brains were dissected and fixed overnight in 4% PFA before then being incubated in 30% sucrose (in PBS) until sunk (approx. 48hrs). A freezing microtome was used to cut 40µm horizontal slices. Citrate antigen retrieval was carried out through incubation of sections with 10mM citric acid, 0.05% Tween 20, pH6 at 95°C for 30 minutes followed by a 20-minute cooling period. Sections were then blocked in 0.05M glycine, 2% BSA and 3% goat serum before incubation overnight in HB7534 (1:250, 1:500 and 1:1,000 dilutions) and HB6429 (mouse monoclonal anti-NeuN, 1:1,000 dilution, 1µg/ml). This was followed by a two-hour incubation with secondary antibodies at a 1:300 dilution (polyclonal goat anti-mouse DyLight 488 and goat anti-rabbit DyLight 650). DAPI (HB0747) was used at 1µg/ml to visualise cell nuclei. For more detail please see our IHC(IF) protocol. Images were captured as a z-stack using a Leica DMI6000B inverted epifluorescence microscope and a 10x objective. A fixed exposure was used for all images (DAP: 24ms, L5: 200ms, Y5:300ms). The stacks were deconvolved using Huygens professional then flattened using a maximum Z projection in ImageJ (Schindelin et al., 2012. Nat Methods, 9(7), 676–682).
Figure 6. Concentration response of HB7534 staining in a rat brain P2 preparation.
HB7534 stains GluA1-4 receptors at with visible bands down to a 1:8,000 dilution (7ng/ml). Method: P2 fractions were prepared from fresh rat brains following established protocols (Molnar et al., 1993. Neuroscience 53:307-326). Rat brain P2 samples were loaded (20µg / lane) onto a 4-20% acrylamide gel alongside a protein ladder (HB9198) before being run at 150V for 45 minutes. Wet transfer to a PVDF membrane was completed in 90 minutes using 400mA. Following transfer, the membrane was cut into strips using Ponceau dye to visualise and cut individual lanes. Strips were blocked for 2hrs in 5% non-fat dry milk before being incubated overnight at 4°C in HB7534. Each strip was incubated separately with a separate HB7534 concentration with this ranging from 1:250 (440ng/ml) to 1:8,000 (7ng/ml) dilutions. Following washing, the membrane was incubated in secondary antibody (1:10,000 dilution, polyclonal goat anti-rabbit HRP conjugated, HB9524) for 2hrs. For more detail please see our Western blotting protocol. Detection was accomplished using Clarity Western ECL substrate and a Licor Odyssey Fc imaging system (ECL channel: 6 min exposure, 700nm channel: 30 sec exposure). Band intensity was calculated using Image Studio version 5.2.5 (LiCor) and a graph was constructed in GraphPad Prism 9 using a 3-parameter Hill equation curve fit.
Figure 7. GluA1-4 and GluN1 colocalization in the dendrite of a cultured cortical neuron visualized using HB7534 and HB7535.
HB7534 and HB7535 stain AMPA and GluN1 receptors respectively in a cultured rat cortical neuron preparation using HB6581 (chicken polyclonal anti-MAP2 antibody) counterstain. Method: neurones were cultured from E17-E18 rat embryos following established protocols (Martin and Henley, 2004. EMBO, 4749–4759) and fixed with 4% PFA on DIV21. Antigen retrieval was carried out by heating the coverslip to 95°C in 100mM Tris, 5% urea, pH9.5. Following washes, cells were permeabilised with 0.1% Triton X-100 followed by blocking in 1% BSA, 300mM glycine. HB7534 (rabbit polyclonal anti-GluA1-4), HB7535 (mouse monoclonal anti-GluN1) and HB6581 (chicken polyclonal anti-MAP2) antibodies were all incubated overnight (4°C) at a 1:1,000 dilution. This was followed by a one-hour incubation with secondary antibodies (Polyclonal goat anti-chicken Alexa Fluor 488 conjugated, 1:300 dilution, polyclonal goat anti-mouse DyLight 550 conjugated, 1:300 dilution and polyclonal goat anti-rabbit DyLight 650 conjugated, 1:300 dilution). DAPI (HB0747) was used at 1µg/ml to visualise cell nuclei. For more detail please see our ICC protocol. Images were captured using a Leica SP8 AOBS confocal laser scanning microscope attached to a Leica DM I8 inverted epifluorescence microscope. The image was captured in Lightning deconvolution mode using a 63x objective (3.89x zoom), 405nm (11.1% power, PMT: 673V gain), 488nm (1% power, Hyd: 10% gain), 561nm (1% power, HyD: 10% gain) and 633nm (5% power, Hyd: 19.6% gain) laser lines in a z-stack (0.38µm spacing). The stack was flattened using a maximum Z projection in ImageJ (Schindelin et al., 2012. Nat Methods, 9(7), 676–682).
Figure 8. GluA1-4 expression in various tissue lysates and preparations.
HB7534 revealed the ≈111kDa band associated with GluA1-4 in brain membrane fractions with evidence for an internalised degradation fragment weighing ≈53kDa in brain cytosol fractions. Method: mouse brain and rat brain membrane (P2) and cytosol fractions were prepared following previous work (Molnar et al., 1993. Neuroscience 53:307-326) from freshly collected adult brains. Other tissue lysates were prepared following established protocols from freshly dissected tissue (see our guide on WB sample preparation). Samples were loaded (20µg / lane) onto a 4-20% acrylamide gel alongside a protein ladder (HB9198) before being run at 150V for 45 minutes. Wet transfer to a PVDF membrane was completed in 90 minutes using 400mA. The membrane was blocked for 2hrs in 5% non-fat dry milk before being incubated overnight at 4°C in HB7534 at a 1:500 dilution. Following washing, the membrane was incubated in secondary antibody (1:20,000 dilution, Polyclonal goat anti-rabbit HRP conjugated, HB9524) for 2hrs. For more detail please see our Western blotting protocol. Detection was accomplished using Clarity Western ECL substrate (BioRad, 1705061) and a Licor Odyssey Fc imaging system (ECL channel: 8 min exposure, 700nm channel: 30 sec exposure).
Figure 9. GluA1-4 and GluN1 colocalization in cultured cortical neurons visualized using HB7534 and HB7535.
HB7534 and HB7535 stain AMPA and GluN1 receptors respectively in a cultured rat cortical neuron preparation using HB6581 (chicken polyclonal anti-MAP2 antibody) counterstain. Method: neurones were cultured from E17-E18 rat embryos following established protocols (Martin and Henley, 2004. EMBO, 4749–4759) and fixed with 4% PFA on DIV21. Antigen retrieval was carried out by heating the coverslip to 95°C in 100mM Tris, 5% urea, pH9.5. Following washes, cells were permeabilised with 0.1% Triton X-100 followed by blocking in 1% BSA, 300mM glycine. HB7534 (rabbit polyclonal anti-GluA1-4), HB7535 (mouse monoclonal anti-GluN1) and HB6581 (chicken polyclonal anti-MAP2) antibodies were all incubated overnight (4°C) at a 1:1,000 dilution. This was followed by a one-hour incubation with secondary antibodies (Polyclonal goat anti-chicken Alexa Fluor 488 conjugated, 1:300 dilution, polyclonal goat anti-mouse DyLight 550 conjugated, 1:300 dilution and polyclonal goat anti-rabbit DyLight 650 conjugated, 1:300 dilution). DAPI (HB0747) was used at 1µg/ml to visualise cell nuclei. For more detail please see our ICC protocol. Images were captured using a Leica DMI6000B inverted epifluorescence microscope attached to a Photometric-Prime95B camera. The image was captured using a 40x objective with DAP (40ms), L5 (52ms), RHO (80ms) and Y5 (296ms) filters in a z-stack (0.3µm spacing). The image was deconvolved using Huygens software before the stack was flattened using a maximum Z projection in ImageJ (Schindelin et al., 2012. Nat Methods, 9(7), 676–682).
Figure 10. AMPA receptor expression in rat dentate gyrus and CA1 mapped using HB7534.
HB7534 labels the dense expression of AMPA receptors in the dentate gyrus and CA1. Method: Rat brains were dissected and fixed overnight in 4% PFA before then being incubated in 30% sucrose (in PBS) until sunk (approx. 48hrs). A freezing microtome was used to cut 40µm horizontal slices. Citrate antigen retrieval was carried out through incubation of sections with 10mM citric acid, 0.05% Tween 20, pH6 at 95°C for 30 minutes followed by a 20-minute cooling period. Sections were then blocked in 0.05M glycine, 2% BSA and 3% goat serum before incubation overnight in HB7534 (1:250 dilution) and HB6429 (mouse monoclonal anti-NeuN, 1:1,000 dilution, 1µg/ml). This was followed by a two-hour incubation with secondary antibodies at a 1:300 dilution (polyclonal goat anti-mouse DyLight 488 and goat anti-rabbit DyLight 650). DAPI (HB0747) was used at 1µg/ml to visualise cell nuclei. For more detail please see our IHC(IF) protocol. Images were captured as a tilescan using a Leica DMI6000B inverted epifluorescence microscope. The image was captured using a 10x objective in a z-stack (9.6µm spacing). The image was captured using DAP (24ms exposure), L5 (200ms exposure) and Y5 (300ms exposure) filters. The stack was deconvolved using Huygens professional then flattened using a maximum Z projection in ImageJ (Schindelin et al., 2012. Nat Methods, 9(7), 676–682).
Figure 1. GluA1-4 expression in cultured cortical neurons visualized using HB7534.
HB7534 stains AMPA receptors in a cultured rat cortical neuron using HB6581 (chicken polyclonal anti-MAP2 antibody) counterstain. Method: neurones were cultured from E17-E18 rat embryos following established protocols (Martin and Henley, 2004. EMBO, 4749–4759) and fixed with 4% PFA on DIV21. Antigen retrieval was carried out by heating the coverslip to 95°C in 100mM Tris, 5% urea, pH9.5. Following washes, cells were permeabilised with 0.1% Triton X-100 followed by blocking in 1% BSA, 300mM glycine. HB7534 (rabbit polyclonal anti-GluA1-4) and HB6581 (chicken polyclonal anti-MAP2) antibodies were incubated overnight (4°C) at a 1:1,000 dilution. This was followed by a one-hour incubation with secondary antibodies (Polyclonal goat anti-chicken Alexa Fluor 488 conjugated, 1:300 dilution and polyclonal goat anti-rabbit DyLight 650 conjugated, 1:300 dilution). DAPI (HB0747) was used at 1µg/ml to visualise cell nuclei. For more detail please see our ICC protocol. Images were captured using a Leica SP8 AOBS confocal laser scanning microscope attached to a Leica DM I8 inverted epifluorescence microscope. The image was captured in Lightning deconvolution mode using a 40x objective (1.28x zoom), 405nm (11.1% power, PMT: 717V gain), 488nm (1% power, Hyd: 10% gain), 561nm (1% power, HyD: 10% gain) and 633nm (5% power, Hyd: 54.1% gain) laser lines in a z-stack (0.44µm spacing). The stack was flattened using a maximum Z projection in ImageJ (Schindelin et al., 2012. Nat Methods, 9(7), 676–682).
Figure 2. AMPA receptor expression in rat dentate gyrus and CA1 mapped using HB7534.
HB7534 labels the dense expression of AMPA receptors in the dentate gyrus and CA1. Method: Rat brains were dissected and fixed overnight in 4% PFA before then being incubated in 30% sucrose (in PBS) until sunk (approx. 48hrs). A freezing microtome was used to cut 40µm horizontal slices. Citrate antigen retrieval was carried out through incubation of sections with 10mM citric acid, 0.05% Tween 20, pH6 at 95°C for 30 minutes followed by a 20-minute cooling period. Sections were then blocked in 0.05M glycine, 2% BSA and 3% goat serum before incubation overnight in HB7534 (1:250 dilution) and HB6429 (mouse monoclonal anti-NeuN, 1:1,000 dilution, 1µg/ml). This was followed by a two-hour incubation with secondary antibodies at a 1:300 dilution (polyclonal goat anti-mouse DyLight 488 and goat anti-rabbit DyLight 650). DAPI (HB0747) was used at 1µg/ml to visualise cell nuclei. For more detail please see our IHC(IF) protocol. Images were captured as a tilescan using a Leica DMI6000B inverted epifluorescence microscope. The image was captured using a 10x objective in a z-stack (9.6µm spacing). The image was captured using DAP (24ms exposure), L5 (200ms exposure) and Y5 (300ms exposure) filters. The stack was deconvolved using Huygens professional then flattened using a maximum Z projection in ImageJ (Schindelin et al., 2012. Nat Methods, 9(7), 676–682).
Figure 3. GluA1-4 and GluN1 colocalization in cultured cortical neurons visualized using HB7534 and HB7535.
HB7534 and HB7535 stain AMPA and GluN1 receptors respectively in a cultured rat cortical neuron preparation using HB6581 (chicken polyclonal anti-MAP2 antibody) counterstain. Method: neurones were cultured from E17-E18 rat embryos following established protocols (Martin and Henley, 2004. EMBO, 4749–4759) and fixed with 4% PFA on DIV21. Antigen retrieval was carried out by heating the coverslip to 95°C in 100mM Tris, 5% urea, pH9.5. Following washes, cells were permeabilised with 0.1% Triton X-100 followed by blocking in 1% BSA, 300mM glycine. HB7534 (rabbit polyclonal anti-GluA1-4), HB7535 (mouse monoclonal anti-GluN1) and HB6581 (chicken polyclonal anti-MAP2) antibodies were all incubated overnight (4°C) at a 1:1,000 dilution. This was followed by a one-hour incubation with secondary antibodies (Polyclonal goat anti-chicken Alexa Fluor 488 conjugated, 1:300 dilution, polyclonal goat anti-mouse DyLight 550 conjugated, 1:300 dilution and polyclonal goat anti-rabbit DyLight 650 conjugated, 1:300 dilution). DAPI (HB0747) was used at 1µg/ml to visualise cell nuclei. For more detail please see our ICC protocol. Images were captured using a Leica SP8 AOBS confocal laser scanning microscope attached to a Leica DM I8 inverted epifluorescence microscope. The image was captured in Lightning deconvolution mode using a 63x objective (2.01x zoom), 405nm (11.1% power, PMT: 673V gain), 488nm (1% power, Hyd: 10% gain), 561nm (1% power, HyD: 10% gain) and 633nm (5% power, Hyd: 18.6% gain) laser lines in a z-stack (0.38µm spacing). The stack was flattened using a maximum Z projection in ImageJ (Schindelin et al., 2012. Nat Methods, 9(7), 676–682).
Figure 4. GluA1-4 expression in various tissue lysates and preparations.
HB7534 revealed the ≈108kDa band associated with GluA1-4 in brain membrane fractions with evidence for an internalised degradation fragment weighing ≈51kDa in brain cytosol fractions. Method: mouse brain and rat brain membrane (P2) and cytosol fractions were prepared following previous work (Molnar et al., 1993. Neuroscience 53:307-326) from freshly collected adult brains. Other tissue lysates were prepared following established protocols from freshly dissected tissue (see our guide on WB sample preparation). Samples were loaded (20µg / lane) onto a 4-20% acrylamide gel alongside a protein ladder before being run at 150V for 45 minutes. Wet transfer to a PVDF membrane was completed in 90 minutes using 400mA. The membrane was blocked for 2hrs in 5% non-fat dry milk before being incubated overnight at 4°C in HB7534 at a 1:2,000 dilution. Following washing, the membrane was incubated in secondary antibody (1:20,000 dilution, Polyclonal goat anti-rabbit HRP conjugated, HB9524) for 2hrs. For more detail please see our Western blotting protocol. Detection was accomplished using Clarity Western ECL substrate (BioRad, 1705061) and a Licor Odyssey Fc imaging system (ECL channel: 8 min exposure, 700nm channel: 30 sec exposure). Following imaging the membrane was stripped with HB7756 stripping buffer before being washed, blocked for 2 hours in 5% non-fat dry milk and incubated in HB9177 (mouse monoclonal anti-GAPDH, 1:4,000 dilution, 0.25µg/ml) overnight at 4°C. Following washing the membrane was incubated in a 1:10,000 dilution of polyclonal goat anti-mouse HRP conjugated secondary antibody (HB8356) for 2hrs and visualised again using Clarity Western ECL substrate and a Licor Odyssey Fc imaging system (ECL channel: 4 min exposure, 700nm channel: 30 sec exposure).
Figure 5. Concentration response of HB7534 staining in rat hippocampus.
HB7534 concentration response in rat hippocampus shows optimal labelling at a 1:250 dilution. Method: Rat brains were dissected and fixed overnight in 4% PFA before then being incubated in 30% sucrose (in PBS) until sunk (approx. 48hrs). A freezing microtome was used to cut 40µm horizontal slices. Citrate antigen retrieval was carried out through incubation of sections with 10mM citric acid, 0.05% Tween 20, pH6 at 95°C for 30 minutes followed by a 20-minute cooling period. Sections were then blocked in 0.05M glycine, 2% BSA and 3% goat serum before incubation overnight in HB7534 (1:250, 1:500 and 1:1,000 dilutions) and HB6429 (mouse monoclonal anti-NeuN, 1:1,000 dilution, 1µg/ml). This was followed by a two-hour incubation with secondary antibodies at a 1:300 dilution (polyclonal goat anti-mouse DyLight 488 and goat anti-rabbit DyLight 650). DAPI (HB0747) was used at 1µg/ml to visualise cell nuclei. For more detail please see our IHC(IF) protocol. Images were captured as a z-stack using a Leica DMI6000B inverted epifluorescence microscope and a 10x objective. A fixed exposure was used for all images (DAP: 24ms, L5: 200ms, Y5:300ms). The stacks were deconvolved using Huygens professional then flattened using a maximum Z projection in ImageJ (Schindelin et al., 2012. Nat Methods, 9(7), 676–682).
Figure 6. Concentration response of HB7534 staining in a rat brain P2 preparation.
HB7534 stains GluA1-4 receptors at with visible bands down to a 1:8,000 dilution (7ng/ml). Method: P2 fractions were prepared from fresh rat brains following established protocols (Molnar et al., 1993. Neuroscience 53:307-326). Rat brain P2 samples were loaded (20µg / lane) onto a 4-20% acrylamide gel alongside a protein ladder (HB9198) before being run at 150V for 45 minutes. Wet transfer to a PVDF membrane was completed in 90 minutes using 400mA. Following transfer, the membrane was cut into strips using Ponceau dye to visualise and cut individual lanes. Strips were blocked for 2hrs in 5% non-fat dry milk before being incubated overnight at 4°C in HB7534. Each strip was incubated separately with a separate HB7534 concentration with this ranging from 1:250 (440ng/ml) to 1:8,000 (7ng/ml) dilutions. Following washing, the membrane was incubated in secondary antibody (1:10,000 dilution, polyclonal goat anti-rabbit HRP conjugated, HB9524) for 2hrs. For more detail please see our Western blotting protocol. Detection was accomplished using Clarity Western ECL substrate and a Licor Odyssey Fc imaging system (ECL channel: 6 min exposure, 700nm channel: 30 sec exposure). Band intensity was calculated using Image Studio version 5.2.5 (LiCor) and a graph was constructed in GraphPad Prism 9 using a 3-parameter Hill equation curve fit.
Figure 7. GluA1-4 and GluN1 colocalization in the dendrite of a cultured cortical neuron visualized using HB7534 and HB7535.
HB7534 and HB7535 stain AMPA and GluN1 receptors respectively in a cultured rat cortical neuron preparation using HB6581 (chicken polyclonal anti-MAP2 antibody) counterstain. Method: neurones were cultured from E17-E18 rat embryos following established protocols (Martin and Henley, 2004. EMBO, 4749–4759) and fixed with 4% PFA on DIV21. Antigen retrieval was carried out by heating the coverslip to 95°C in 100mM Tris, 5% urea, pH9.5. Following washes, cells were permeabilised with 0.1% Triton X-100 followed by blocking in 1% BSA, 300mM glycine. HB7534 (rabbit polyclonal anti-GluA1-4), HB7535 (mouse monoclonal anti-GluN1) and HB6581 (chicken polyclonal anti-MAP2) antibodies were all incubated overnight (4°C) at a 1:1,000 dilution. This was followed by a one-hour incubation with secondary antibodies (Polyclonal goat anti-chicken Alexa Fluor 488 conjugated, 1:300 dilution, polyclonal goat anti-mouse DyLight 550 conjugated, 1:300 dilution and polyclonal goat anti-rabbit DyLight 650 conjugated, 1:300 dilution). DAPI (HB0747) was used at 1µg/ml to visualise cell nuclei. For more detail please see our ICC protocol. Images were captured using a Leica SP8 AOBS confocal laser scanning microscope attached to a Leica DM I8 inverted epifluorescence microscope. The image was captured in Lightning deconvolution mode using a 63x objective (3.89x zoom), 405nm (11.1% power, PMT: 673V gain), 488nm (1% power, Hyd: 10% gain), 561nm (1% power, HyD: 10% gain) and 633nm (5% power, Hyd: 19.6% gain) laser lines in a z-stack (0.38µm spacing). The stack was flattened using a maximum Z projection in ImageJ (Schindelin et al., 2012. Nat Methods, 9(7), 676–682).
Figure 8. GluA1-4 expression in various tissue lysates and preparations.
HB7534 revealed the ≈111kDa band associated with GluA1-4 in brain membrane fractions with evidence for an internalised degradation fragment weighing ≈53kDa in brain cytosol fractions. Method: mouse brain and rat brain membrane (P2) and cytosol fractions were prepared following previous work (Molnar et al., 1993. Neuroscience 53:307-326) from freshly collected adult brains. Other tissue lysates were prepared following established protocols from freshly dissected tissue (see our guide on WB sample preparation). Samples were loaded (20µg / lane) onto a 4-20% acrylamide gel alongside a protein ladder (HB9198) before being run at 150V for 45 minutes. Wet transfer to a PVDF membrane was completed in 90 minutes using 400mA. The membrane was blocked for 2hrs in 5% non-fat dry milk before being incubated overnight at 4°C in HB7534 at a 1:500 dilution. Following washing, the membrane was incubated in secondary antibody (1:20,000 dilution, Polyclonal goat anti-rabbit HRP conjugated, HB9524) for 2hrs. For more detail please see our Western blotting protocol. Detection was accomplished using Clarity Western ECL substrate (BioRad, 1705061) and a Licor Odyssey Fc imaging system (ECL channel: 8 min exposure, 700nm channel: 30 sec exposure).
Figure 9. GluA1-4 and GluN1 colocalization in cultured cortical neurons visualized using HB7534 and HB7535.
HB7534 and HB7535 stain AMPA and GluN1 receptors respectively in a cultured rat cortical neuron preparation using HB6581 (chicken polyclonal anti-MAP2 antibody) counterstain. Method: neurones were cultured from E17-E18 rat embryos following established protocols (Martin and Henley, 2004. EMBO, 4749–4759) and fixed with 4% PFA on DIV21. Antigen retrieval was carried out by heating the coverslip to 95°C in 100mM Tris, 5% urea, pH9.5. Following washes, cells were permeabilised with 0.1% Triton X-100 followed by blocking in 1% BSA, 300mM glycine. HB7534 (rabbit polyclonal anti-GluA1-4), HB7535 (mouse monoclonal anti-GluN1) and HB6581 (chicken polyclonal anti-MAP2) antibodies were all incubated overnight (4°C) at a 1:1,000 dilution. This was followed by a one-hour incubation with secondary antibodies (Polyclonal goat anti-chicken Alexa Fluor 488 conjugated, 1:300 dilution, polyclonal goat anti-mouse DyLight 550 conjugated, 1:300 dilution and polyclonal goat anti-rabbit DyLight 650 conjugated, 1:300 dilution). DAPI (HB0747) was used at 1µg/ml to visualise cell nuclei. For more detail please see our ICC protocol. Images were captured using a Leica DMI6000B inverted epifluorescence microscope attached to a Photometric-Prime95B camera. The image was captured using a 40x objective with DAP (40ms), L5 (52ms), RHO (80ms) and Y5 (296ms) filters in a z-stack (0.3µm spacing). The image was deconvolved using Huygens software before the stack was flattened using a maximum Z projection in ImageJ (Schindelin et al., 2012. Nat Methods, 9(7), 676–682).
Figure 10. AMPA receptor expression in rat dentate gyrus and CA1 mapped using HB7534.
HB7534 labels the dense expression of AMPA receptors in the dentate gyrus and CA1. Method: Rat brains were dissected and fixed overnight in 4% PFA before then being incubated in 30% sucrose (in PBS) until sunk (approx. 48hrs). A freezing microtome was used to cut 40µm horizontal slices. Citrate antigen retrieval was carried out through incubation of sections with 10mM citric acid, 0.05% Tween 20, pH6 at 95°C for 30 minutes followed by a 20-minute cooling period. Sections were then blocked in 0.05M glycine, 2% BSA and 3% goat serum before incubation overnight in HB7534 (1:250 dilution) and HB6429 (mouse monoclonal anti-NeuN, 1:1,000 dilution, 1µg/ml). This was followed by a two-hour incubation with secondary antibodies at a 1:300 dilution (polyclonal goat anti-mouse DyLight 488 and goat anti-rabbit DyLight 650). DAPI (HB0747) was used at 1µg/ml to visualise cell nuclei. For more detail please see our IHC(IF) protocol. Images were captured as a tilescan using a Leica DMI6000B inverted epifluorescence microscope. The image was captured using a 10x objective in a z-stack (9.6µm spacing). The image was captured using DAP (24ms exposure), L5 (200ms exposure) and Y5 (300ms exposure) filters. The stack was deconvolved using Huygens professional then flattened using a maximum Z projection in ImageJ (Schindelin et al., 2012. Nat Methods, 9(7), 676–682).
Product information
Immunogen
Fusion protein expressed in and purified from E.coli consisting of residues 724-781 of GluR1flop conjugated to Glutathione-S-transferase (GST)
Purification
Dual stage immunogen affinity purification consisting of a first stage to remove GST reactive antibodies and a second stage to purify only specific anti-GluA1-4 antibodies.
Concentration
0.11mg/ml
Formulation
Lyophilised, When reconstituted contains PBS with 1% recombinant human albumin and 0.05% sodium azide
Predicted species reactivity
Mouse, Rat
Tested species reactivity
Mouse, Rat
Tested applications
Applications
ICC, WB, IHC(IF)
Western blot optimal concentration
1:2000 dilution as tested in a rat brain P2 membrane preparation
IHC(IF) optimal concentration
1:250 dilution as tested in rat brain hippocampal sections. Please note that utilisation of a citrate antigen retrieval protocol is required for successful staining.
ICC optimal concentration
1:1,000 dilution as tested in cultured rat hippocampal neurons. Please note that antigen retrieval is required for successful staining (we recommend 100mM Tris, 5% Urea, pH9.5, 95°C)
Positive control
AMPAR receptors are widely expressed in the brain therefore neural tissues serve as an excellent positive control.
Negative control
Tissues such as the liver and heart lack AMPA expression while popular cell lines such as HeLa and HEK293 also lack expression therefore are good negative controls.
AMPA receptors are subject to alternative splicing resulting in two variants known as flip and flop (see Sommer et al., 1990 for more information). While there is evidence that these different isoforms have different functional properties both isoforms for each receptor have the same number of amino acids and therefore almost identical molecular weights.
Expression
AMPA receptors are widely expresed in the CNS with particularly high expression in the hippocampus, cortex and cerebellum. AMPA receptors have also been found to be expressed in peripheral tissues where they regulate insulin release (see Wu et al., 2012).
Subcellular expression
AMPA receptors are primarily expressed within both the pre and post-synaptic densities found within the axon terminals and dendrites of neurones respectively.
Target function
AMPA receptors are the main excitatory neurotransmitter receptor in the CNS and upon glutamate binding allow Na+ and Ca2+ ions to enter the cell and cause depolarization.
Processing
All AMPA receptor isoforms contain a N-terminal signal peptide which drives their translocation to the cell membrane.
Post translational modifications
All AMPA receptor isoforms are subject to glycosylation on multiple residues with GluA1 and GluA2 also being subject to phosphorylation at multiple sites too.
Homology (compared to human)
GluA1: Mouse and rat show 97.8% and 98.6% homology to the human homologue respectively GluA2: Mouse and rat show 99.7% and 99.6% homology to the human homologue respectively GluA3: Mouse and rat show 98.5% and 99.4% homology to the human homologue respectively GluA4: Mouse and rat show 99.7% and 98.2% homology to the human homologue respectively
Epitope homology (between species)
A BLAST search using the immunogen sequence shows the following homologies for each species against each receptor target:
Receptor
Species
Human
Mouse
Rat
GluA1
100.0%
93.1%
100.0%
GluA2
96.6%
94.8%
94.8%
GluA3
96.6%
93.1%
94.8%
GluA4
89.7%
89.7%
91.4%
Epitope homology (other proteins)
A BLAST search using the immunogen sequence against all human targets provides the following proteins with significant homology:
GluA1 - 100.0% homology
GluA2 - 96.6% homology
GluA3 - 96.6% homology
GluA4 - 89.7% homology
GluK1 - 48.3% homology
GluK2 - 46.6% homology
GluK3 - 48.3% homology
GluK4 - 50.0% homology
GluK5 - 48.3% homology
GluD1 - 44.0% homology
GluD3 - 37.3% homology
GluN2D - 34.0% homology
Storage & Handling
Storage instructions
-20°C then use reconstitution advice
Reconstitution advice
Upon receipt store at either -20°C or -80°C.
For 100μg packs either:
Reconstitute with 100μl dH2O and store at 4°C
Reconstitute with 50μl dH2O and 50μl glycerol then store at -20°C
Reconstitute with 100μl dH2O, aliquot then snap freeze and store at -80°C
For 25μg packs either:
Reconstitute with 25μl dH2O and store at 4°C
Reconstitute with 12.5μl dH2O and 12.5μl glycerol then store at -20°C
Reconstitute with 25μl dH2O, aliquot then snap freeze and store at -80°C
For more information read our guide on the best care for your product. Take care when opening as the precipitate is extremely light and can easily be lost if disturbed. When reconstituting make sure that the antibody is thoroughly dissolved by pipetting up and down before giving the antibody a brief spin at 10,000g to make sure that all material is recovered and at the bottom of the tube.
Shipping Conditions
Stable for ambient temperature shipping. Follow storage instructions on receipt.
Important
This product is for RESEARCH USE ONLY and is not intended for therapeutic or diagnostic use. Not for human or veterinary use
What protocols are available for use with this GluA1-4 antibody
We have made a comprehensive collection of protocols that we have used in our experiments to validate this GluA1-4 antibody
What counterstains do you recommend for use in ICC and IHC with this GluA1-4 antibody?
We recommend using either DAPI or Hoechst 33342 to label cell nuclei. In some experiments it is also helpful to label actin filaments in the cytoskeleton using a Phalloidin conjugate such as FITC Phalloidin or Rhodamine Phalloidin-TRITC.
What guarantee do you have that my GluA1-4 antibody will perform as expected?
We guarantee that your GluA1-4 antibody will work for the applications and species we list on the datasheet. If the antibody fails to perform as expected then we are happy to offer a 100% refund guarantee. For more details please see our guarantee policy.
Will my GluA1-4 antibody work against species that have not been listed on the datasheet?
A species not being listed doesn’t mean that the antibody won’t work, just that we haven’t tested it. If you test one of our antibodies in a new species please let us know (positive or negative)!
What counterstains do you recommend for use in ICC and IHC with this antibody?
We recommend using either DAPI or Hoechst 33342 to label cell nuclei. In some experiments it is also helpful to label actin filaments in the cytoskeleton using a Phalloidin conjugate such as FITC Phalloidin or Rhodamine Phalloidin-TRITC.


 Western Blot Protocol (1 MB)