Figure 1. β3-tubulin expression in the Purkinje cells of the cerebellum labelled by HB6639.
HB6639 labels the dense dendritic arbor of the Purkinje cells found in rat cerebellum. Method: Rat brains were dissected and fixed overnight in 4% PFA before then being incubated in 30% sucrose (in PBS) until sunk (approx. 48hrs). A freezing microtome was used to cut 40µm horizontal slices before sections were incubated in 1% NaBH4 for 15 minutes. Sections were blocked in 0.05M glycine, 2% BSA and 3% goat serum before incubation overnight in HB6639 (1:1000, 1µg/ml) and HB6498 (1:2,000 dilution). This was followed by a two hour incubation with secondary antibodies at a 1:300 dilution (polyclonal goat anti-mouse DyLight 488, Thermofisher, 35503 and goat anti-rabbit DyLight 650, Thermofisher 11804574). DAPI was included in the mounting media to visualise cell nuclei. For more detail please see our IHC(IF) protocol. Images were captured using Leica DMI6000B inverted epifluorescence microscope attached to a DFC365FX monochrome digital camera. The image was captured as a tilescan and z-stack (1.0µm spacing) using a 40x objective, A4 (24.8ms @ 5.2x gain), GFP (526ms @ 5.5x gain) and Y5 (326ms @ 5.2x gain) filters. The image was merged in LASX then deconvolved in Huygens professional before being flattened using a maximum Z projection in ImageJ (Schindelin et al., 2012. Nat Methods, 9(7), 676–682).
Figure 2. β3-tubulin expression visualised with HB6639 used to label cultured rat neurones
HB6639 staining revealed a dense network of neuronal processes created by DIV21 cultured rat neurones. Method: neurones were cultured from PND2 rats following established protocols (Brewer and Torricelli, 2007. Nat Protoc 2, 1490–1498) and fixed with 4% PFA on DIV21. Cells were permeabilised with 0.1% Triton X-100 followed by blocking in 1% BSA, 300mM glycine. HB6639 was incubated overnight (4°C) at a 1:1000 dilution (1µg/ml) followed by a one hour incubation with secondary antibody (Polyclonal goat anti-mouse DyLight 488 conjugated, Thermofisher 35503, 1:500 dilution). DAPI (HB0747) was used at 1µg/ml to visualise cell nuclei. For more detail please see our ICC protocol. Images were captured using a Leica DM2500 epifluorescence microscope (20x objective) coupled to a Leica DFC7000T colour digital camera with DAPI LP (3.4x gain, 15.0ms exposure) and I3 (3.4x gain, 582.4ms exposure) filters. The image was processed in ImageJ (Schindelin et al., 2012. Nat Methods, 9(7), 676–682) using the subtract background (50px rolling ball radius) tool.
Figure 3. β3-tubulin expression in various tissue lysates and preparations.
HB6639 revealed a single band of size 53kDa primarily present in brain cytosol fractions. Endogenous mouse IgGs were also detected by the secondary antibody in mouse tissue. Method: mouse brain and rat brain membrane (P2) and cytosol fractions were prepared following previous work (Molnar et al., 1993. Neuroscience 53:307-326) from freshly collected adult brains. Other tissue lysates were prepared following established protocols from freshly dissected tissue (see our guide on WB sample preparation). Samples were loaded (20µg / lane) onto a 10% acrylamide gel alongside a protein ladder (Thermofisher, 26616) before being run at 60V for 40 minutes followed by 120V for 90 minutes. Wet transfer to a PVDF membrane was completed in 90 minutes using 400mA. The membrane was blocked for 2hrs in 5% non-fat dry milk before being incubated overnight at 4°C in HB6639 at a 1:1000 dilution (1µg/ml). Following washing, the membrane was incubated in secondary antibody (1:10,000 dilution, Polyclonal goat anti-mouse HRP conjugated, Sigma Aldrich A3682) for 2hrs. For more detail please see our Western blotting protocol. Detection was accomplished using Clarity Western ECL substrate (BioRad, 1705061) and a Licor Odyssey Fc imaging system (ECL channel: 10 min exposure, 700nm channel: 30 sec exposure).
Figure 4. β3-tubulin expression in the pyramidal cell layer of the hippocampus labelled by HB6639.
HB6639 labels the dendritic projections of pyramidal neurones found in the rat hippocampus. Method: Rat brains were dissected and fixed overnight in 4% PFA before then being incubated in 30% sucrose (in PBS) until sunk (approx. 48hrs). A freezing microtome was used to cut 40µm horizontal slices before sections were incubated in 1% NaBH4 for 15 minutes. Sections were blocked in 0.05M glycine, 2% BSA and 3% goat serum before incubation overnight in HB6639 (1:1000, 1µg/ml) and HB6498 (1:2,000 dilution). This was followed by a two hour incubation with secondary antibodies at a 1:300 dilution (polyclonal goat anti-mouse DyLight 488, Thermofisher, 35503 and goat anti-rabbit DyLight 650, Thermofisher 11804574). Propidium Iodide was included in the mounting media to visualise cell nuclei. For more detail please see our IHC(IF) protocol. Images were captured using Leica DMI6000B inverted epifluorescence microscope attached to a DFC365FX monochrome digital camera. The image was captured as a tilescan and z-stack (3.4µm spacing) using a 20x objective, GFP (526.6ms @ 5.5x gain), Y3 (469ms @ 5.2x gain) and Y5 (132.4ms @ 5.2x gain). The image was merged in LASX then deconvolved in Huygens professional before being flattened using a maximum Z projection in ImageJ (Schindelin et al., 2012. Nat Methods, 9(7), 676–682).
Figure 5. Concentration response of HB6639 in rat caudate putamen
HB6639 successfully labelled cell bodies and dendritic processes at a range of dilutions in rat caudate putamen. Method: Rat brains were dissected and fixed overnight in 4% PFA before then being incubated in 30% sucrose (in PBS) until sunk (approx. 48hrs). A freezing microtome was used to cut 40µm horizontal slices before sections were incubated in 1% NaBH4 for 15 minutes. Sections were blocked in 0.05M glycine, 2% BSA and 3% goat serum before incubation overnight in HB6639 (1:1,000 to 1:8,000 dilutions). This was followed by a two-hour incubation with secondary antibody at a 1:300 dilution (polyclonal goat anti-mouse DyLight 550). DAPI (HB0747) was used at 1µg/ml to visualise cell nuclei and sections were mounted using MightyMount Antifade Fluorescence Mounting Medium (hardset). For more detail please see our IHC(IF) protocol. Images were captured using a Leica DMI6000B inverted epifluorescence microscope. Images were captured using a 20x objective in a z-stack (0.59µm spacing). Stacks were deconvolved using Huygens professional then flattened using a maximum Z projection in ImageJ (Schindelin et al., 2012. Nat Methods, 9(7), 676–682). Exposure times were as follows:
• 1:1,000 – DAP: 24ms, RHO: 103ms
• 1:2,000 – DAP: 20ms, RHO: 176ms
• 1:4,000 – DAP: 25ms, RHO: 100ms
• 1:8,000 – DAP: 20ms, RHO: 221ms
Figure 6. β3-tubulin and Neurofilament L expression in rat cerebellum
HB6639 labels the Purkinje cells found in the rat cerebellum. Method: Rat brains were dissected and fixed overnight in 4% PFA before then being incubated in 30% sucrose (in PBS) until sunk (approx. 48hrs). A freezing microtome was used to cut 40µm horizontal slices before sections were incubated in 1% NaBH4 for 15 minutes. Sections were blocked in 0.05M glycine, 2% BSA and 3% goat serum before incubation overnight in HB6639 (1:1000, 1µg/ml) and HB7266 (rabbit monoclonal anti-neurofilament L, 1:4,000 dilution). This was followed by a two hour incubation with secondary antibodies at a 1:300 dilution (polyclonal goat anti-mouse DyLight 550, Thermofisher, 84540 and goat anti-rabbit DyLight 650, Thermofisher 11804574). DAPI (HB0747) was used at 1µg/ml to visualise cell nuclei. For more detail please see our IHC(IF) protocol. Images were captured using Leica DMI6000B inverted epifluorescence microscope attached to a DFC365FX monochrome digital camera. The image was captured as a tilescan and z-stack (2.4µm spacing) using a 20x objective, A4 (25.5ms @ 2.1x gain), Y3 (247.7ms @ 2.5x gain) and Y5 (108.3ms @ 3.5x gain) filters. The image was merged in LASX then deconvolved in Huygens professional before being flattened using a maximum Z projection in ImageJ (Schindelin et al., 2012. Nat Methods, 9(7), 676–682).
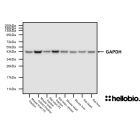
Figure 7. β3-tubulin expression in various tissue lysates and preparations with GAPDH loading control.
HB6639 revealed a single band of size 51kDa primarily present in brain cytosol fractions. Method: mouse brain and rat brain membrane (P2) and cytosol fractions were prepared following previous work (Molnar et al., 1993. Neuroscience 53:307-326) from freshly collected adult brains. Other tissue lysates were prepared following established protocols from freshly dissected tissue (see our guide on WB sample preparation). Samples were loaded (20µg / lane) onto a 12% acrylamide gel alongside a protein ladder (BioRad Precision Plus dual colour, 1610374) before being run at 60V for 30 minutes followed by 120V for 100 minutes. Wet transfer to a PVDF membrane was completed in 90 minutes using 400mA. The membrane was blocked for 2hrs in 5% non-fat dry milk before being incubated overnight at 4°C in HB6639 at a 1:1000 dilution (1µg/ml) and HB9177 (anti-GAPDH monoclonal antibody) at a 1:2,000 dilution (0.5µg/ml). Following washing, the membrane was incubated in secondary antibody (1:10,000 dilution, Polyclonal goat anti-mouse HRP conjugated, Sigma Aldrich A3682) for 2hrs. For more detail please see our Western blotting protocol. Detection was accomplished using Clarity Western ECL substrate (BioRad, 1705061) and a Licor Odyssey Fc imaging system (ECL channel: 10 min exposure, 700nm channel: 30 sec exposure).
Figure 8. β3-tubulin and Neurofilament L expression in rat cerebellum
HB6639 labels the Purkinje cells found in the rat cerebellum. Method: Rat brains were dissected and fixed overnight in 4% PFA before then being incubated in 30% sucrose (in PBS) until sunk (approx. 48hrs). A freezing microtome was used to cut 40µm horizontal slices before sections were incubated in 1% NaBH4 for 15 minutes. Sections were blocked in 0.05M glycine, 2% BSA and 3% goat serum before incubation overnight in HB6639 (1:1000, 1µg/ml) and HB7266 (rabbit monoclonal anti-neurofilament L, 1:4,000 dilution). This was followed by a two hour incubation with secondary antibodies at a 1:300 dilution (polyclonal goat anti-mouse DyLight 550, Thermofisher, 84540 and goat anti-rabbit DyLight 650, Thermofisher 11804574). DAPI (HB0747) was used at 1µg/ml to visualise cell nuclei. For more detail please see our IHC(IF) protocol. Images were captured using Leica DMI6000B inverted epifluorescence microscope attached to a DFC365FX monochrome digital camera. The image was captured as a tilescan and z-stack (2.4µm spacing) in Lightning deconvolution mode using a 20x objective, A4 (73.9ms @ 1x gain), Y3 (63.5ms @ 4.4x gain) and Y5 (55.1ms @ 4.3x gain) filters. The image was merged in LASX then deconvolved in Huygens professional before being flattened using a maximum Z projection in ImageJ (Schindelin et al., 2012. Nat Methods, 9(7), 676–682).
Figure 9. Concentration response of HB6639 staining in a rat brain cytosol preparation.
HB6639 shows consistent results with low background at dilutions as low as 1:8,000 (125 ng/ml). Method: cytosol fractions were prepared from fresh rat brains following established protocols (Molnar et al., 1993. Neuroscience 53:307-326). Rat cytosol samples were loaded (20µg / lane) onto a 10% acrylamide gel alongside a protein ladder (Thermofisher, 26616) before being run at 60V for 41 minutes followed by 120V for 85 minutes. Wet transfer to a PVDF membrane was completed in 93 minutes using 400mA. Following transfer the membrane was cut into strips between markers. Strips were blocked for 2hrs in 5% non-fat dry milk before being incubated overnight at 4°C in HB6639. Each strip was incubated separately with a separate HB6639 concentration with this ranging from 2µg/ml (1:500 dilution) to 125ng/ml (1:8,000 dilution). Following washing, the membrane was incubated in secondary antibody (1:10,000 dilution, Polyclonal goat anti-mouse HRP conjugated, Sigma Aldrich A3682) for 2hrs. For more detail please see our Western blotting protocol. Detection was accomplished using Clarity Western ECL substrate (BioRad, 1705061) and a Licor Odyssey Fc imaging system (ECL channel: 10 min exposure, 700nm channel: 30 sec exposure). Band intensity was calculated using Image Studio version 5.2.5 (LiCor) and a graph was constructed in GraphPad Prism 9 using a 3-parameter Hill equation curve fit.
Figure 10. β3-tubulin and Neurofilament L expression in rat cerebellum
HB6639 labels the Purkinje cells found in the rat cerebellum. Method: Rat brains were dissected and fixed overnight in 4% PFA before then being incubated in 30% sucrose (in PBS) until sunk (approx. 48hrs). A freezing microtome was used to cut 40µm horizontal slices before sections were incubated in 1% NaBH4 for 15 minutes. Sections were blocked in 0.05M glycine, 2% BSA and 3% goat serum before incubation overnight in HB6639 (1:1000, 1µg/ml) and HB7266 (rabbit monoclonal anti-neurofilament L, 1:4,000 dilution). This was followed by a two hour incubation with secondary antibodies at a 1:300 dilution (polyclonal goat anti-mouse DyLight 550, Thermofisher, 84540 and goat anti-rabbit DyLight 650, Thermofisher 11804574). DAPI (HB0747) was used at 1µg/ml to visualise cell nuclei. For more detail please see our IHC(IF) protocol. Images were captured using Leica DMI6000B inverted epifluorescence microscope attached to a DFC365FX monochrome digital camera. The image was captured as a tilescan and z-stack (2.4µm spacing) in Lightning deconvolution mode using a 20x objective, A4 (73.9ms @ 1x gain), Y3 (133ms @ 4.4x gain) and Y5 (120.6ms @ 4.3x gain) filters. The image was merged in LASX then deconvolved in Huygens professional before being flattened using a maximum Z projection in ImageJ (Schindelin et al., 2012. Nat Methods, 9(7), 676–682).
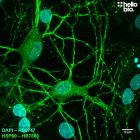
Figure 11. β3-tubulin expression visualised with HB6639 used to label cultured rat neurones.
HB6639 staining revealed a dense network of neuronal processes created by DIV21 cultured rat neurones. Method: neurones were cultured from PND2 rats following established protocols (Brewer and Torricelli, 2007. Nat Protoc 2, 1490–1498) and fixed with 4% PFA on DIV21. Cells were permeabilised with 0.1% Triton X-100 followed by blocking in 1% BSA, 300mM glycine. HB6639 was incubated overnight (4°C) at a 1:500 dilution (2µg/ml) followed by a one hour incubation with secondary antibody (Polyclonal goat anti-mouse DyLight 488 conjugated, Thermofisher 35503, 1:300 dilution). DAPI (HB0747) was used at 1µg/ml to visualise cell nuclei. For more detail please see our ICC protocol. Images were captured using a Leica SPE confocal laser scanning microscope coupled to a Leica DMi8 inverted epifluorescence microscope. The image was captured using a 40x objective (1.28x zoom), 405nm (43.5% power, gain: 658) and 488nm (44.6% power, gain: 998) laser lines in a z-stack (0.24 µm spacing). Deconvolution was carried out using Huygens Essential (Scientific Volume Imagine) followed by the stack being flattened using a maximum Z projection in ImageJ (Schindelin et al., 2012. Nat Methods, 9(7), 676–682).
Figure 12. Concentration response of HB6639 in rat cerebellum
Rat cerebellum showing microglia stained for IBA1 with HB7847 and Purkinje cells stained for βIII-tubulin with HB6639. Method: Rat brains were dissected and fixed overnight in 4% PFA before then being incubated in 30% sucrose (in PBS) until sunk (approx. 48hrs). A freezing microtome was used to cut 40µm horizontal slices before sections were incubated in 1% NaBH4 for 15 minutes. Sections were blocked in 0.05M glycine, 2% BSA and 3% goat serum before incubation overnight in HB7847 (1:1,000 to 1:4,000 dilutions) and HB6639 (1:1,000 to 1:4,000 dilutions). This was followed by a two-hour incubation with secondary antibodies at a 1:300 dilution (polyclonal goat anti-mouse DyLight 550, Thermofisher, 84540 and polyclonal goat anti-rabbit DyLight 650, Thermofisher, 11804574). DAPI (HB0747) was used at 1µg/ml to visualise cell nuclei and sections were mounted using MightyMount Antifade Fluorescence Mounting Medium (hardset). For more detail please see our IHC(IF) protocol. Images were captured using a Leica DMI6000B inverted epifluorescence microscope. Images were captured using a 20x objective in a z-stack (0.59µm spacing). Stacks were deconvolved using Huygens professional then flattened using a maximum Z projection in ImageJ (Schindelin et al., 2012. Nat Methods, 9(7), 676–682). Exposure times were as follows:
• 1:1,000 – DAP: 20ms, RHO: 80ms, Y5: 87ms
• 1:2,000 – DAP: 20ms, RHO: 80ms, Y5: 87ms
• 1:4,000 – DAP: 65ms, RHO: 100ms, Y5: 150ms
Figure 1. β3-tubulin expression in the Purkinje cells of the cerebellum labelled by HB6639.
HB6639 labels the dense dendritic arbor of the Purkinje cells found in rat cerebellum. Method: Rat brains were dissected and fixed overnight in 4% PFA before then being incubated in 30% sucrose (in PBS) until sunk (approx. 48hrs). A freezing microtome was used to cut 40µm horizontal slices before sections were incubated in 1% NaBH4 for 15 minutes. Sections were blocked in 0.05M glycine, 2% BSA and 3% goat serum before incubation overnight in HB6639 (1:1000, 1µg/ml) and HB6498 (1:2,000 dilution). This was followed by a two hour incubation with secondary antibodies at a 1:300 dilution (polyclonal goat anti-mouse DyLight 488, Thermofisher, 35503 and goat anti-rabbit DyLight 650, Thermofisher 11804574). DAPI was included in the mounting media to visualise cell nuclei. For more detail please see our IHC(IF) protocol. Images were captured using Leica DMI6000B inverted epifluorescence microscope attached to a DFC365FX monochrome digital camera. The image was captured as a tilescan and z-stack (1.0µm spacing) using a 40x objective, A4 (24.8ms @ 5.2x gain), GFP (526ms @ 5.5x gain) and Y5 (326ms @ 5.2x gain) filters. The image was merged in LASX then deconvolved in Huygens professional before being flattened using a maximum Z projection in ImageJ (Schindelin et al., 2012. Nat Methods, 9(7), 676–682).
Figure 2. β3-tubulin expression visualised with HB6639 used to label cultured rat neurones
HB6639 staining revealed a dense network of neuronal processes created by DIV21 cultured rat neurones. Method: neurones were cultured from PND2 rats following established protocols (Brewer and Torricelli, 2007. Nat Protoc 2, 1490–1498) and fixed with 4% PFA on DIV21. Cells were permeabilised with 0.1% Triton X-100 followed by blocking in 1% BSA, 300mM glycine. HB6639 was incubated overnight (4°C) at a 1:1000 dilution (1µg/ml) followed by a one hour incubation with secondary antibody (Polyclonal goat anti-mouse DyLight 488 conjugated, Thermofisher 35503, 1:500 dilution). DAPI (HB0747) was used at 1µg/ml to visualise cell nuclei. For more detail please see our ICC protocol. Images were captured using a Leica DM2500 epifluorescence microscope (20x objective) coupled to a Leica DFC7000T colour digital camera with DAPI LP (3.4x gain, 15.0ms exposure) and I3 (3.4x gain, 582.4ms exposure) filters. The image was processed in ImageJ (Schindelin et al., 2012. Nat Methods, 9(7), 676–682) using the subtract background (50px rolling ball radius) tool.
Figure 3. β3-tubulin expression in various tissue lysates and preparations.
HB6639 revealed a single band of size 53kDa primarily present in brain cytosol fractions. Endogenous mouse IgGs were also detected by the secondary antibody in mouse tissue. Method: mouse brain and rat brain membrane (P2) and cytosol fractions were prepared following previous work (Molnar et al., 1993. Neuroscience 53:307-326) from freshly collected adult brains. Other tissue lysates were prepared following established protocols from freshly dissected tissue (see our guide on WB sample preparation). Samples were loaded (20µg / lane) onto a 10% acrylamide gel alongside a protein ladder (Thermofisher, 26616) before being run at 60V for 40 minutes followed by 120V for 90 minutes. Wet transfer to a PVDF membrane was completed in 90 minutes using 400mA. The membrane was blocked for 2hrs in 5% non-fat dry milk before being incubated overnight at 4°C in HB6639 at a 1:1000 dilution (1µg/ml). Following washing, the membrane was incubated in secondary antibody (1:10,000 dilution, Polyclonal goat anti-mouse HRP conjugated, Sigma Aldrich A3682) for 2hrs. For more detail please see our Western blotting protocol. Detection was accomplished using Clarity Western ECL substrate (BioRad, 1705061) and a Licor Odyssey Fc imaging system (ECL channel: 10 min exposure, 700nm channel: 30 sec exposure).
Figure 4. β3-tubulin expression in the pyramidal cell layer of the hippocampus labelled by HB6639.
HB6639 labels the dendritic projections of pyramidal neurones found in the rat hippocampus. Method: Rat brains were dissected and fixed overnight in 4% PFA before then being incubated in 30% sucrose (in PBS) until sunk (approx. 48hrs). A freezing microtome was used to cut 40µm horizontal slices before sections were incubated in 1% NaBH4 for 15 minutes. Sections were blocked in 0.05M glycine, 2% BSA and 3% goat serum before incubation overnight in HB6639 (1:1000, 1µg/ml) and HB6498 (1:2,000 dilution). This was followed by a two hour incubation with secondary antibodies at a 1:300 dilution (polyclonal goat anti-mouse DyLight 488, Thermofisher, 35503 and goat anti-rabbit DyLight 650, Thermofisher 11804574). Propidium Iodide was included in the mounting media to visualise cell nuclei. For more detail please see our IHC(IF) protocol. Images were captured using Leica DMI6000B inverted epifluorescence microscope attached to a DFC365FX monochrome digital camera. The image was captured as a tilescan and z-stack (3.4µm spacing) using a 20x objective, GFP (526.6ms @ 5.5x gain), Y3 (469ms @ 5.2x gain) and Y5 (132.4ms @ 5.2x gain). The image was merged in LASX then deconvolved in Huygens professional before being flattened using a maximum Z projection in ImageJ (Schindelin et al., 2012. Nat Methods, 9(7), 676–682).
Figure 5. Concentration response of HB6639 in rat caudate putamen
HB6639 successfully labelled cell bodies and dendritic processes at a range of dilutions in rat caudate putamen. Method: Rat brains were dissected and fixed overnight in 4% PFA before then being incubated in 30% sucrose (in PBS) until sunk (approx. 48hrs). A freezing microtome was used to cut 40µm horizontal slices before sections were incubated in 1% NaBH4 for 15 minutes. Sections were blocked in 0.05M glycine, 2% BSA and 3% goat serum before incubation overnight in HB6639 (1:1,000 to 1:8,000 dilutions). This was followed by a two-hour incubation with secondary antibody at a 1:300 dilution (polyclonal goat anti-mouse DyLight 550). DAPI (HB0747) was used at 1µg/ml to visualise cell nuclei and sections were mounted using MightyMount Antifade Fluorescence Mounting Medium (hardset). For more detail please see our IHC(IF) protocol. Images were captured using a Leica DMI6000B inverted epifluorescence microscope. Images were captured using a 20x objective in a z-stack (0.59µm spacing). Stacks were deconvolved using Huygens professional then flattened using a maximum Z projection in ImageJ (Schindelin et al., 2012. Nat Methods, 9(7), 676–682). Exposure times were as follows:
• 1:1,000 – DAP: 24ms, RHO: 103ms
• 1:2,000 – DAP: 20ms, RHO: 176ms
• 1:4,000 – DAP: 25ms, RHO: 100ms
• 1:8,000 – DAP: 20ms, RHO: 221ms
Figure 6. β3-tubulin and Neurofilament L expression in rat cerebellum
HB6639 labels the Purkinje cells found in the rat cerebellum. Method: Rat brains were dissected and fixed overnight in 4% PFA before then being incubated in 30% sucrose (in PBS) until sunk (approx. 48hrs). A freezing microtome was used to cut 40µm horizontal slices before sections were incubated in 1% NaBH4 for 15 minutes. Sections were blocked in 0.05M glycine, 2% BSA and 3% goat serum before incubation overnight in HB6639 (1:1000, 1µg/ml) and HB7266 (rabbit monoclonal anti-neurofilament L, 1:4,000 dilution). This was followed by a two hour incubation with secondary antibodies at a 1:300 dilution (polyclonal goat anti-mouse DyLight 550, Thermofisher, 84540 and goat anti-rabbit DyLight 650, Thermofisher 11804574). DAPI (HB0747) was used at 1µg/ml to visualise cell nuclei. For more detail please see our IHC(IF) protocol. Images were captured using Leica DMI6000B inverted epifluorescence microscope attached to a DFC365FX monochrome digital camera. The image was captured as a tilescan and z-stack (2.4µm spacing) using a 20x objective, A4 (25.5ms @ 2.1x gain), Y3 (247.7ms @ 2.5x gain) and Y5 (108.3ms @ 3.5x gain) filters. The image was merged in LASX then deconvolved in Huygens professional before being flattened using a maximum Z projection in ImageJ (Schindelin et al., 2012. Nat Methods, 9(7), 676–682).
Figure 7. β3-tubulin expression in various tissue lysates and preparations with GAPDH loading control.
HB6639 revealed a single band of size 51kDa primarily present in brain cytosol fractions. Method: mouse brain and rat brain membrane (P2) and cytosol fractions were prepared following previous work (Molnar et al., 1993. Neuroscience 53:307-326) from freshly collected adult brains. Other tissue lysates were prepared following established protocols from freshly dissected tissue (see our guide on WB sample preparation). Samples were loaded (20µg / lane) onto a 12% acrylamide gel alongside a protein ladder (BioRad Precision Plus dual colour, 1610374) before being run at 60V for 30 minutes followed by 120V for 100 minutes. Wet transfer to a PVDF membrane was completed in 90 minutes using 400mA. The membrane was blocked for 2hrs in 5% non-fat dry milk before being incubated overnight at 4°C in HB6639 at a 1:1000 dilution (1µg/ml) and HB9177 (anti-GAPDH monoclonal antibody) at a 1:2,000 dilution (0.5µg/ml). Following washing, the membrane was incubated in secondary antibody (1:10,000 dilution, Polyclonal goat anti-mouse HRP conjugated, Sigma Aldrich A3682) for 2hrs. For more detail please see our Western blotting protocol. Detection was accomplished using Clarity Western ECL substrate (BioRad, 1705061) and a Licor Odyssey Fc imaging system (ECL channel: 10 min exposure, 700nm channel: 30 sec exposure).
Figure 8. β3-tubulin and Neurofilament L expression in rat cerebellum
HB6639 labels the Purkinje cells found in the rat cerebellum. Method: Rat brains were dissected and fixed overnight in 4% PFA before then being incubated in 30% sucrose (in PBS) until sunk (approx. 48hrs). A freezing microtome was used to cut 40µm horizontal slices before sections were incubated in 1% NaBH4 for 15 minutes. Sections were blocked in 0.05M glycine, 2% BSA and 3% goat serum before incubation overnight in HB6639 (1:1000, 1µg/ml) and HB7266 (rabbit monoclonal anti-neurofilament L, 1:4,000 dilution). This was followed by a two hour incubation with secondary antibodies at a 1:300 dilution (polyclonal goat anti-mouse DyLight 550, Thermofisher, 84540 and goat anti-rabbit DyLight 650, Thermofisher 11804574). DAPI (HB0747) was used at 1µg/ml to visualise cell nuclei. For more detail please see our IHC(IF) protocol. Images were captured using Leica DMI6000B inverted epifluorescence microscope attached to a DFC365FX monochrome digital camera. The image was captured as a tilescan and z-stack (2.4µm spacing) in Lightning deconvolution mode using a 20x objective, A4 (73.9ms @ 1x gain), Y3 (63.5ms @ 4.4x gain) and Y5 (55.1ms @ 4.3x gain) filters. The image was merged in LASX then deconvolved in Huygens professional before being flattened using a maximum Z projection in ImageJ (Schindelin et al., 2012. Nat Methods, 9(7), 676–682).
Figure 9. Concentration response of HB6639 staining in a rat brain cytosol preparation.
HB6639 shows consistent results with low background at dilutions as low as 1:8,000 (125 ng/ml). Method: cytosol fractions were prepared from fresh rat brains following established protocols (Molnar et al., 1993. Neuroscience 53:307-326). Rat cytosol samples were loaded (20µg / lane) onto a 10% acrylamide gel alongside a protein ladder (Thermofisher, 26616) before being run at 60V for 41 minutes followed by 120V for 85 minutes. Wet transfer to a PVDF membrane was completed in 93 minutes using 400mA. Following transfer the membrane was cut into strips between markers. Strips were blocked for 2hrs in 5% non-fat dry milk before being incubated overnight at 4°C in HB6639. Each strip was incubated separately with a separate HB6639 concentration with this ranging from 2µg/ml (1:500 dilution) to 125ng/ml (1:8,000 dilution). Following washing, the membrane was incubated in secondary antibody (1:10,000 dilution, Polyclonal goat anti-mouse HRP conjugated, Sigma Aldrich A3682) for 2hrs. For more detail please see our Western blotting protocol. Detection was accomplished using Clarity Western ECL substrate (BioRad, 1705061) and a Licor Odyssey Fc imaging system (ECL channel: 10 min exposure, 700nm channel: 30 sec exposure). Band intensity was calculated using Image Studio version 5.2.5 (LiCor) and a graph was constructed in GraphPad Prism 9 using a 3-parameter Hill equation curve fit.
Figure 10. β3-tubulin and Neurofilament L expression in rat cerebellum
HB6639 labels the Purkinje cells found in the rat cerebellum. Method: Rat brains were dissected and fixed overnight in 4% PFA before then being incubated in 30% sucrose (in PBS) until sunk (approx. 48hrs). A freezing microtome was used to cut 40µm horizontal slices before sections were incubated in 1% NaBH4 for 15 minutes. Sections were blocked in 0.05M glycine, 2% BSA and 3% goat serum before incubation overnight in HB6639 (1:1000, 1µg/ml) and HB7266 (rabbit monoclonal anti-neurofilament L, 1:4,000 dilution). This was followed by a two hour incubation with secondary antibodies at a 1:300 dilution (polyclonal goat anti-mouse DyLight 550, Thermofisher, 84540 and goat anti-rabbit DyLight 650, Thermofisher 11804574). DAPI (HB0747) was used at 1µg/ml to visualise cell nuclei. For more detail please see our IHC(IF) protocol. Images were captured using Leica DMI6000B inverted epifluorescence microscope attached to a DFC365FX monochrome digital camera. The image was captured as a tilescan and z-stack (2.4µm spacing) in Lightning deconvolution mode using a 20x objective, A4 (73.9ms @ 1x gain), Y3 (133ms @ 4.4x gain) and Y5 (120.6ms @ 4.3x gain) filters. The image was merged in LASX then deconvolved in Huygens professional before being flattened using a maximum Z projection in ImageJ (Schindelin et al., 2012. Nat Methods, 9(7), 676–682).
Figure 11. β3-tubulin expression visualised with HB6639 used to label cultured rat neurones.
HB6639 staining revealed a dense network of neuronal processes created by DIV21 cultured rat neurones. Method: neurones were cultured from PND2 rats following established protocols (Brewer and Torricelli, 2007. Nat Protoc 2, 1490–1498) and fixed with 4% PFA on DIV21. Cells were permeabilised with 0.1% Triton X-100 followed by blocking in 1% BSA, 300mM glycine. HB6639 was incubated overnight (4°C) at a 1:500 dilution (2µg/ml) followed by a one hour incubation with secondary antibody (Polyclonal goat anti-mouse DyLight 488 conjugated, Thermofisher 35503, 1:300 dilution). DAPI (HB0747) was used at 1µg/ml to visualise cell nuclei. For more detail please see our ICC protocol. Images were captured using a Leica SPE confocal laser scanning microscope coupled to a Leica DMi8 inverted epifluorescence microscope. The image was captured using a 40x objective (1.28x zoom), 405nm (43.5% power, gain: 658) and 488nm (44.6% power, gain: 998) laser lines in a z-stack (0.24 µm spacing). Deconvolution was carried out using Huygens Essential (Scientific Volume Imagine) followed by the stack being flattened using a maximum Z projection in ImageJ (Schindelin et al., 2012. Nat Methods, 9(7), 676–682).
Figure 12. Concentration response of HB6639 in rat cerebellum
Rat cerebellum showing microglia stained for IBA1 with HB7847 and Purkinje cells stained for βIII-tubulin with HB6639. Method: Rat brains were dissected and fixed overnight in 4% PFA before then being incubated in 30% sucrose (in PBS) until sunk (approx. 48hrs). A freezing microtome was used to cut 40µm horizontal slices before sections were incubated in 1% NaBH4 for 15 minutes. Sections were blocked in 0.05M glycine, 2% BSA and 3% goat serum before incubation overnight in HB7847 (1:1,000 to 1:4,000 dilutions) and HB6639 (1:1,000 to 1:4,000 dilutions). This was followed by a two-hour incubation with secondary antibodies at a 1:300 dilution (polyclonal goat anti-mouse DyLight 550, Thermofisher, 84540 and polyclonal goat anti-rabbit DyLight 650, Thermofisher, 11804574). DAPI (HB0747) was used at 1µg/ml to visualise cell nuclei and sections were mounted using MightyMount Antifade Fluorescence Mounting Medium (hardset). For more detail please see our IHC(IF) protocol. Images were captured using a Leica DMI6000B inverted epifluorescence microscope. Images were captured using a 20x objective in a z-stack (0.59µm spacing). Stacks were deconvolved using Huygens professional then flattened using a maximum Z projection in ImageJ (Schindelin et al., 2012. Nat Methods, 9(7), 676–682). Exposure times were as follows:
• 1:1,000 – DAP: 20ms, RHO: 80ms, Y5: 87ms
• 1:2,000 – DAP: 20ms, RHO: 80ms, Y5: 87ms
• 1:4,000 – DAP: 65ms, RHO: 100ms, Y5: 150ms
Product information
Immunogen
Amino acids 441-448 of human beta III tubulin coupled to maleimide-activated keyhole limpet hemocyanin
Epitope
ESESQGPK (Amino acids 441-448 of beta III tubulin)
Clone number
TU-20
Isotype
IgG1
Purification
Protein A affinity chromatography
Concentration
1mg/ml
Formulation
Lyophilised. When reconstituted contains PBS with 15mM sodium azide and 1% recombinant BSA
Predicted species reactivity
Human, Mouse, Rat, Pig, Dog
Tested species reactivity
Mouse, Rat
Tested applications
Applications
ICC, WB, IHC(IF)
Western blot optimal concentration
1µg/ml (1:1000) as measured in rat brain cytosol
IHC(IF) optimal concentration
1µg/ml (1:1000) as measured in free-floating fixed hippocampal sections
ICC optimal concentration
1µg/ml (1:1000) as measured in a cultured rat hippocampal neuron preparation.
Positive control
ß3-tubulin is widely expressed in neural tissues. It is also well expressed in SH-SY5Y, Hep G2, A549 and SCLC-21H cell lines.
Negative control
Non-neural tissues, except for tissue from the testes. Poorly expressed in many cell lines such as JURKAT, HeLa and HEK293.
Beta III tubulin has two isoforms. Isoform 1: canonical; Isoform 2: missing amino acids 1-72
Expression
Beta III tubulin is expressed almost exclusively within neurones present in the central nervous system and peripheral nervous system. Expression has also been found within the sertoli cells of the testes.
Subcellular expression
Beta III tubulin is a key cytoskeletal component therefore is widely expressed as bundles of Beta III tubulin positive fibres.
Target function
Beta III tubulin forms a key part of the cytoskeleton in neurones and has also been reported to have important roles in regulating the oxidative stress and glucose deprivation response in neurones. Beta III tubulin has also been found to be an important prognostic indicator in cancer with expression being associated with treatment resistance and tumour aggressiveness.
Processing
Following translation no processing is required for Beta III tubulin to reach its active conformation.
Post translational modifications
Beta III tubulin is subject to three postranslational modifications: phosphorylation by CDK1 at Ser172, Polyglutamylation at Glu438 and phosphorylation at Ser 444 (note: this is within the epitope of HB6639)
Homology (compared to human)
Mouse and human proteins are identical while rat beta III tubulin shows a single change (E440D)
Similar proteins
Beta III tubulin shows similarity in a BLAST search to other beta tubulin family members (e.g. Tubulin beta IV 100%, tubulin beta VI 96%, tubulin beta IIA 95%, tubulin beta IIB 95%) alongside alpha tubulin (96% similarity) and epididymis sperm binding protein (95%)
Epitope homology (between species)
The epitope sequence is conserved between humans, mice and rats within beta III tubulin
Epitope homology (other proteins)
Proteins containing the sequence of the epitope of HB6639 include:
Bromodomain and PHD finger containing protein (1aa difference) 135.7kDa,
MAP2 (85.7% match) - 199.5kDa,
MAPK2 (87.5% match) - 42kDa,
FAM43A (85.7% match) - 46kDa
Storage & Handling
Storage instructions
-20°C then use reconstitution advice
Reconstitution advice
Upon receipt store at either -20°C or -80°C.
For 100μg packs either:
Reconstitute with 100μl dH2O and store at 4°C
Reconstitute with 50μl dH2O and 50μl glycerol then store at -20°C
Reconstitute with 100μl dH2O, aliquot then snap freeze and store at -80°C
For 25μg packs either:
Reconstitute with 25μl dH2O and store at 4°C
Reconstitute with 12.5μl dH2O and 12.5μl glycerol then store at -20°C
Reconstitute with 25μl dH2O, aliquot then snap freeze and store at -80°C
For more information read our guide on the best care for your product. Take care when opening as the precipitate is extremely light and can easily be lost if disturbed. When reconstituting make sure that the antibody is thoroughly dissolved by pipetting up and down before giving the antibody a brief spin at 10,000g to make sure that all material is recovered and at the bottom of the tube.
Shipping Conditions
Stable for ambient temperature shipping. Follow storage instructions on receipt.
Important
This product is for RESEARCH USE ONLY and is not intended for therapeutic or diagnostic use. Not for human or veterinary use
What counterstains do you recommend for use in ICC and IHC with this antibody?
We recommend using either DAPI or Hoechst 33342 to label cell nuclei. In some experiments it is also helpful to label actin filaments in the cytoskeleton using a Phalloidin conjugate such as FITC Phalloidin or Rhodamine Phalloidin-TRITC.
What guarantee do you have that my Beta III tubulin antibody will perform as expected?
We guarantee that your Beta III tubulin antibody will work for the applications and species we list on the datasheet. If the antibody fails to perform as expected then we are happy to offer a 100% refund guarantee. For more details please see our guarantee policy.
Will my Beta III tubulin antibody work against species that have not been listed on the datasheet?
A species not being listed doesn’t mean that the Beta III tubulin antibody won’t work, just that we haven’t tested it. If you test one of our antibodies in a new species please let us know (positive or negative)!
What protocols are available for use with this Beta III tubulin antibody
We have made a comprehensive collection of protocols that we have used in our experiments to validate this Beta III tubulin antibody.
What counterstains do you recommend for use in ICC and IHC with this Beta III tubulin antibody?
We recommend using either DAPI or Hoechst 33342 to label cell nuclei. In some experiments it is also helpful to label actin filaments in the cytoskeleton using a Phalloidin conjugate such as FITC Phalloidin or Rhodamine Phalloidin-TRITC.
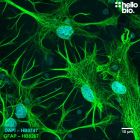
Antibody to HSP60 - loading control and mitochondrial marker for immunohistochemistry and immunocytochemistry. Part of the ValidAb™ range of highly validated, data-rich antibodies.


 Western Blot Protocol (1 MB)