Antibody to IBA1 - calcium binding protein widely used as a marker for microglial cells. Part of the ValidAb™ range of highly validated, data-rich antibodies.
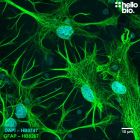
Figure 1. Cerebellar microglia stained for IBA1 with HB7847.
Rat cerebellum showing microglia stained for IBA1 with HB7847 and Purkinje cells stained for βIII-tubulin with HB6639. Method: Rat brains were dissected and fixed overnight in 4% PFA before then being incubated in 30% sucrose (in PBS) until sunk (approx. 48hrs). A freezing microtome was used to cut 40µm horizontal slices before sections were incubated in 1% NaBH4 for 15 minutes. Sections were blocked in 0.05M glycine, 2% BSA and 3% goat serum before incubation overnight in HB7847 (1:2,000 dilution) and HB6639 (1:2,000 dilution). This was followed by a two-hour incubation with secondary antibodies at a 1:300 dilution (polyclonal goat anti-mouse DyLight 550, Thermofisher, 84540 and polyclonal goat anti-rabbit DyLight 650, Thermofisher, 11804574). DAPI (HB0747) was used at 1µg/ml to visualise cell nuclei and sections were mounted using MightyMount Antifade Fluorescence Mounting Medium (hardset). For more detail please see our IHC(IF) protocol. Images were captured using a Leica SP8 AOBS confocal laser scanning microscope attached to a Leica DM I8 inverted epifluorescence microscope. The image was captured in as a tilescan in Lightning deconvolution mode using a 40x objective (1.28x zoom), 405nm (16.0% power, PMT: 681V gain), 561nm (4% power, Hyd: 10% gain) and 633nm(4% power, Hyd: 15.3% gain) laser lines in a z-stack (0.96µm spacing). The stack was flattened using a maximum Z projection in ImageJ (Schindelin et al., 2012. Nat Methods, 9(7), 676–682).
Figure 2. Cortical microglia stained for IBA1 with HB7847
Rat cortex showing microglia stained for IBA1 with HB7847. Method: Rat brains were dissected and fixed overnight in 4% PFA before then being incubated in 30% sucrose (in PBS) until sunk (approx. 48hrs). A freezing microtome was used to cut 40µm horizontal slices before sections were incubated in 1% NaBH4 for 15 minutes. Sections were blocked in 0.05M glycine, 2% BSA and 3% goat serum before incubation overnight in HB7847 (1:2,000 dilution). This was followed by a two-hour incubation with secondary antibody at a 1:300 dilution (polyclonal goat anti-rabbit DyLight 650, Thermofisher, 11804574). DAPI (HB0747) was used at 1µg/ml to visualise cell nuclei and sections were mounted using MightyMount Antifade Fluorescence Mounting Medium (hardset). For more detail please see our IHC(IF) protocol. Images were captured using a Leica DMI6000B inverted epifluorescence microscope. The image was captured as a tilescan using a 40x objective in a z-stack (0.3µm spacing). The image was captured using DAP (10ms exposure) and Y5 (39ms exposure) filters. The stack was deconvolved using Huygens professional then flattened using a maximum Z projection in ImageJ (Schindelin et al., 2012. Nat Methods, 9(7), 676–682).
Figure 3. Microglia and neurons stained in the caudate putamen
Rat CPu showing microglia stained for IBA1 with HB7847 and neurons stained for βIII-tubulin with HB6639. Method: Rat brains were dissected and fixed overnight in 4% PFA before then being incubated in 30% sucrose (in PBS) until sunk (approx. 48hrs). A freezing microtome was used to cut 40µm horizontal slices before sections were incubated in 1% NaBH4 for 15 minutes. Sections were blocked in 0.05M glycine, 2% BSA and 3% goat serum before incubation overnight in HB7847 (1:4,000 dilution) and HB6639 (1:4,000 dilution). This was followed by a two-hour incubation with secondary antibodies at a 1:300 dilution (polyclonal goat anti-mouse DyLight 550, Thermofisher, 84540 and polyclonal goat anti-rabbit DyLight 650, Thermofisher, 11804574). DAPI (HB0747) was used at 1µg/ml to visualise cell nuclei and sections were mounted using MightyMount Antifade Fluorescence Mounting Medium (hardset). For more detail please see our IHC(IF) protocol. Images were captured using a Leica DMI6000B inverted epifluorescence microscope. The image was captured using a 20x objective in a z-stack (0.59µm spacing). The image was captured using DAP (25ms exposure), RHO (100ms exposure) and Y5 (150ms exposure) filters. The stack was deconvolved using Huygens professional then flattened using a maximum Z projection in ImageJ (Schindelin et al., 2012. Nat Methods, 9(7), 676–682).
Figure 4. IBA1 expression in different tissue preparations
HB7847 revealed the ≈18.5kDa band associated with IBA1 in rat spleen and brain samples from mice and rats. Two different exposure levels are shown as IBA1 is expressed at much higher levels in spleen that in the brain. No IBA1 reactivity is seen in the HEK293T sample which acts as a negative control. Method: mouse brain and rat brain membrane (P2) and cytosol fractions were prepared following previous work (Molnar et al., 1993. Neuroscience 53:307-326) from freshly collected adult brains. Other tissue lysates were prepared following established protocols from freshly dissected tissue (see our guide on WB sample preparation). Samples were loaded (20µg / lane) onto a 4-20% acrylamide gel alongside a protein ladder before being run at 160V for 45 minutes. Wet transfer to a PVDF membrane was completed in 90 minutes using 400mA. The membrane was blocked for 2hrs in 5% non-fat dry milk before being incubated overnight at 4°C in HB7847 at a 1:1,000 dilution. Following washing, the membrane was incubated in secondary antibody (1:10,000 dilution, Polyclonal goat anti-rabbit HRP conjugated) for 2hrs. For more detail please see our Western blotting protocol. Detection was accomplished using Clarity Western ECL substrate and a Licor Odyssey Fc imaging system (ECL channel: 5 min exposure, 700nm channel: 30 sec exposure). Following imaging the membrane was stripped with two changes of stripping buffer (HB7756) before being washed, blocked for 2 hours in 5% non-fat dry milk and incubated in HB9177 (mouse monoclonal anti-GAPDH, 1:4,000 dilution, 0.25µg/ml) overnight at 4°C. Following washing the membrane was incubated in a 1:10,000 dilution of a polyclonal goat anti-mouse HRP conjugated secondary antibody for 2hrs and visualised again using Clarity Western ECL substrate and a Licor Odyssey Fc imaging system (ECL channel: 4 min exposure, 700nm channel: 30 sec exposure).
Figure 5. IBA1 expressing microglia in the cortex
Rat cortex showing microglia stained for IBA1 with HB7847 and neurons stained for βIII-tubulin with HB6639. Method: Rat brains were dissected and fixed overnight in 4% PFA before then being incubated in 30% sucrose (in PBS) until sunk (approx. 48hrs). A freezing microtome was used to cut 40µm horizontal slices before sections were incubated in 1% NaBH4 for 15 minutes. Sections were blocked in 0.05M glycine, 2% BSA and 3% goat serum before incubation overnight in HB7847 (1:2,000 dilution) and HB6639 (1:2,000 dilution). This was followed by a two-hour incubation with secondary antibodies at a 1:300 dilution (polyclonal goat anti-mouse DyLight 550, Thermofisher, 84540 and polyclonal goat anti-rabbit DyLight 650, Thermofisher, 11804574). DAPI (HB0747) was used at 1µg/ml to visualise cell nuclei and sections were mounted using MightyMount Antifade Fluorescence Mounting Medium (hardset). For more detail please see our IHC(IF) protocol. Images were captured using a Leica DMI6000B inverted epifluorescence microscope. The image was captured as a tilescan using a 40x objective in a z-stack (0.3µm spacing). The image was captured using DAP (10ms exposure), RHO (33ms exposure) and Y5 (39ms exposure) filters. The stack was deconvolved using Huygens professional then flattened using a maximum Z projection in ImageJ (Schindelin et al., 2012. Nat Methods, 9(7), 676–682).
Figure 6. Concentration response of HB7847 staining in rat brain.
HB7847 labels microglia with high signal to noise down to a dilution of 1:8,000. Method: Rat brains were dissected and fixed overnight in 4% PFA before then being incubated in 30% sucrose (in PBS) until sunk (approx. 48hrs). A freezing microtome was used to cut 40µm horizontal slices before sections were incubated in 1% NaBH4 for 15 minutes. Sections were blocked in 0.05M glycine, 2% BSA and 3% goat serum before incubation overnight in HB7847 (1:1,000 to 1:8,000 dilutions). This was followed by a two-hour incubation with secondary antibody at a 1:300 dilution (polyclonal goat anti-rabbit DyLight 650, Thermofisher, 11804574). DAPI (HB0747) was used at 1µg/ml to visualise cell nuclei and sections were mounted using MightyMount Antifade Fluorescence Mounting Medium (hardset). For more detail please see our IHC(IF) protocol. Images were captured using a Leica DMI6000B inverted epifluorescence microscope connected to a Photometric Prime 95B camera. Images were captured using a 20x objective in a z-stack. Images were deconvolved in Huygens professional software before the stack was flattened using a maximum Z projection in ImageJ (Schindelin et al., 2012. Nat Methods, 9(7), 676–682). Exposure times were as follows:
• 1:1000: DAPI: 24.5ms, Y5: 39ms
• 1:2000: DAPI: 20ms, Y5: 87ms
• 1:4000: DAPI: 25ms, Y5: 150ms
• 1:8000: DAPI: 20ms, Y5: 161ms
Figure 7. Independent antibody validation of HB6589 in rat cortex
The staining patterns of HB6589 and a competitor chicken polyclonal anti-IBA1 antibody in rat cortex overlap showing strong evidence for specificity. Method: Rat brains were dissected and fixed overnight in 4% PFA before then being incubated in 30% sucrose (in PBS) until sunk (approx. 48hrs). A freezing microtome was used to cut 40µm horizontal slices before sections were incubated in 1% NaBH4 for 15 minutes. Sections were blocked in 0.05M glycine, 2% BSA and 3% goat serum before incubation overnight in HB7847 (1:2,000 dilution) and competitor polyclonal chicken anti-IBA1 antibody (1:500 dilution). This was followed by a two-hour incubation with secondary antibodies at a 1:300 dilution (polyclonal donkey anti-chicken DyLight 488, Thermofisher, A78948 and polyclonal goat anti-rabbit DyLight 650, Thermofisher, 11804574). DAPI (HB0747) was used at 1µg/ml to visualise cell nuclei and sections were mounted using MightyMount Antifade Fluorescence Mounting Medium (hardset). For more detail please see our IHC(IF) protocol. Images were captured using a Leica DMI6000B inverted epifluorescence microscope. The image was captured using a 20x objective in a z-stack (1µm spacing). The image was captured using DAP (20ms exposure), L5 (103ms exposure) and Y5 (226ms exposure) filters. The stack was deconvolved using Huygens professional then flattened using a maximum Z projection in ImageJ (Schindelin et al., 2012. Nat Methods, 9(7), 676–682).
Figure 8. Microglia expressing IBA1 in rat brain
Rat brain showing microglia stained for IBA1 with HB7847. Method: Rat brains were dissected and fixed overnight in 4% PFA before then being incubated in 30% sucrose (in PBS) until sunk (approx. 48hrs). A freezing microtome was used to cut 40µm horizontal slices before sections were incubated in 1% NaBH4 for 15 minutes. Sections were blocked in 0.05M glycine, 2% BSA and 3% goat serum before incubation overnight in HB7847 (1:1,000 dilution). This was followed by a two-hour incubation with secondary antibody at a 1:300 dilution (polyclonal goat anti-rabbit DyLight 650, Thermofisher, 11804574). DAPI (HB0747) was used at 1µg/ml to visualise cell nuclei and sections were mounted using MightyMount Antifade Fluorescence Mounting Medium (hardset). For more detail please see our IHC(IF) protocol. Images were captured using a Leica DMI6000B inverted epifluorescence microscope. The image was captured as a tilescan using a 40x objective in a z-stack (0.3µm spacing). The image was captured using DAP (9ms exposure) and Y5 (39ms exposure) filters. The stack was deconvolved using Huygens professional then flattened using a maximum Z projection in ImageJ (Schindelin et al., 2012. Nat Methods, 9(7), 676–682).
Figure 9. Microglia and Purkinje cells in the cerebellum
Rat cerebellum showing microglia stained for IBA1 with HB7847 and Purkinje cells stained for βIII-tubulin with HB6639. Method: Rat brains were dissected and fixed overnight in 4% PFA before then being incubated in 30% sucrose (in PBS) until sunk (approx. 48hrs). A freezing microtome was used to cut 40µm horizontal slices before sections were incubated in 1% NaBH4 for 15 minutes. Sections were blocked in 0.05M glycine, 2% BSA and 3% goat serum before incubation overnight in HB7847 (1:2,000 dilution) and HB6639 (1:2,000 dilution). This was followed by a two-hour incubation with secondary antibodies at a 1:300 dilution (polyclonal goat anti-mouse DyLight 550, Thermofisher, 84540 and polyclonal goat anti-rabbit DyLight 650, Thermofisher, 11804574). DAPI (HB0747) was used at 1µg/ml to visualise cell nuclei and sections were mounted using MightyMount Antifade Fluorescence Mounting Medium (hardset). For more detail please see our IHC(IF) protocol. Images were captured using a Leica DMI6000B inverted epifluorescence microscope. The image was captured using a 20x objective in a z-stack (0.59µm spacing). The image was captured using DAP (20ms exposure), RHO (80ms exposure) and Y5 (87ms exposure) filters. The stack was deconvolved using Huygens professional then flattened using a maximum Z projection in ImageJ (Schindelin et al., 2012. Nat Methods, 9(7), 676–682).
Figure 10. Microglia surrounded by dopaminergic projections in the striatum
Rat caudate putamen showing microglia stained for IBA1 with HB7847 and dopaminergic terminals stained for tyrosine hydroxylase with HB6589. Method: Rat brains were dissected and fixed overnight in 4% PFA before then being incubated in 30% sucrose (in PBS) until sunk (approx. 48hrs). A freezing microtome was used to cut 40µm horizontal slices before sections were incubated in 1% NaBH4 for 15 minutes. Sections were blocked in 0.05M glycine, 2% BSA and 3% goat serum before incubation overnight in HB7847 (1:1,000 dilution) and HB6589 (1:1,000 dilution). This was followed by a two-hour incubation with secondary antibodies at a 1:300 dilution (polyclonal donkey anti-chicken DyLight 488, Thermofisher, A78948 and polyclonal goat anti-rabbit DyLight 650, Thermofisher, 11804574). DAPI (HB0747) was used at 1µg/ml to visualise cell nuclei and sections were mounted using MightyMount Antifade Fluorescence Mounting Medium (hardset). For more detail please see our IHC(IF) protocol. Images were captured using a Leica DMI6000B inverted epifluorescence microscope. The image was captured as a tilescan using a 40x objective in a z-stack (0.3µm spacing). The image was captured using DAP (9ms exposure), RHO (142ms exposure) and Y5 (39ms exposure) filters. The stack was deconvolved using Huygens professional then flattened using a maximum Z projection in ImageJ (Schindelin et al., 2012. Nat Methods, 9(7), 676–682).
Figure 11. Independent antibody validation of HB6589 in rat CA1
The staining patterns of HB6589 and a competitor chicken polyclonal anti-IBA1 antibody in rat CA1 overlap showing strong evidence for specificity. Method: Rat brains were dissected and fixed overnight in 4% PFA before then being incubated in 30% sucrose (in PBS) until sunk (approx. 48hrs). A freezing microtome was used to cut 40µm horizontal slices before sections were incubated in 1% NaBH4 for 15 minutes. Sections were blocked in 0.05M glycine, 2% BSA and 3% goat serum before incubation overnight in HB7847 (1:2,000 dilution) and competitor polyclonal chicken anti-IBA1 antibody (1:500 dilution). This was followed by a two-hour incubation with secondary antibodies at a 1:300 dilution (polyclonal donkey anti-chicken DyLight 488, Thermofisher, A78948 and polyclonal goat anti-rabbit DyLight 650, Thermofisher, 11804574). DAPI (HB0747) was used at 1µg/ml to visualise cell nuclei and sections were mounted using MightyMount Antifade Fluorescence Mounting Medium (hardset). For more detail please see our IHC(IF) protocol. Images were captured using a Leica DMI6000B inverted epifluorescence microscope. The image was captured using a 20x objective in a z-stack (1µm spacing). The image was captured using DAP (20ms exposure), L5 (103ms exposure) and Y5 (226ms exposure) filters. The stack was deconvolved using Huygens professional then flattened using a maximum Z projection in ImageJ (Schindelin et al., 2012. Nat Methods, 9(7), 676–682).
Product information
Immunogen
C-terminal peptide of human IBA1 coupled to keyhole limpet haemocyanin (KLH)
Purification
Unpurified
Formulation
Lyophilized. When reconstituted contains serum + 0.03% sodium azide
Predicted species reactivity
Mouse, Rat, Human
Tested species reactivity
Mouse, Rat
Tested applications
Applications
IHC(IF)
IHC(IF) optimal concentration
1:2,000 dilution as tested in free-floating paraformaldehyde fixed rat brain sections
Positive control
IBA1 is widely expressed in microglia across the CNS making brain tissue an excellent positive control. Adittionally there is high IBA1 expression in the spleen which is another popular positive control.
Negative control
IBA1 expression is absent in many popular cell lines such as HEK293T and HeLa making them a good negative control.
Isoform 3 - 132aa, 14.6kDa, missing residues 121-147 and difference in sequence between residue 1 and 65.
Expression
Expressed in myeloid lineage cells including microglia within the CNS and circulating macrophages. IBA1 is also expressed in dendritic cells and osteoclasts.
Subcellular expression
Cytosolic
Target function
IBA1 is involved in the activation of macrophages and as part of this has been associated with multiple processes. IBA1 has been found to be involved in the formation of membrane ruffles, F-actin remodelling, regulation of cell cycle progression, and phagocytosis.
Processing
IBA1 has the initiator methionine removed to form an active conformation
Post translational modifications
IBA1 is subject to phosphorylation on residues S2, S38 and S39 in adittion to acetylation on K11.
Homology (compared to human)
A BLAST search revealed the following homologies:
Mouse - 89.1% homology
Rat - 89.8% homology
Similar proteins
A BLAST search identified the following similar proteins to IBA1:
AIF2, 66.2% homology
Swiprosin-1, 44.4% homology
Swiprosin-2, 47.1% homology
Storage & Handling
Storage instructions
-20°C then use reconstitution advice
Reconstitution advice
Upon receipt store at either -20°C or -80°C.
For 100μg packs either:
Reconstitute with 100μl dH2O and store at 4°C
Reconstitute with 50μl dH2O and 50μl glycerol then store at -20°C
Reconstitute with 100μl dH2O, aliquot then snap freeze and store at -80°C
For 25μg packs either:
Reconstitute with 25μl dH2O and store at 4°C
Reconstitute with 12.5μl dH2O and 12.5μl glycerol then store at -20°C
Reconstitute with 25μl dH2O, aliquot then snap freeze and store at -80°C
For more information read our guide on the best care for your product. Take care when opening as the precipitate is extremely light and can easily be lost if disturbed. When reconstituting make sure that the antibody is thoroughly dissolved by pipetting up and down before giving the antibody a brief spin at 10,000g to make sure that all material is recovered and at the bottom of the tube.
Shipping Conditions
Stable for ambient temperature shipping. Follow storage instructions on receipt.
Important
This product is for RESEARCH USE ONLY and is not intended for therapeutic or diagnostic use. Not for human or veterinary use
What counterstains do you recommend for use in ICC and IHC with this IBA1 antibody?
We recommend using either DAPI or Hoechst 33342 to label cell nuclei. In some experiments it is also helpful to label actin filaments in the cytoskeleton using a Phalloidin conjugate such as FITC Phalloidin or Rhodamine Phalloidin-TRITC.
What guarantee do you have that my IBA1 antibody will perform as expected?
We guarantee that your IBA1 antibody will work for the applications and species we list on the datasheet. If the antibody fails to perform as expected then we are happy to offer a 100% refund guarantee. For more details please see our guarantee policy.
What protocols are available for use with this IBA1 antibody
We have made a comprehensive collection of protocols that we have used in our experiments to validate this IBA1 antibody.
Will my IBA1 antibody work against species that have not been listed on the datasheet?
A species not being listed doesn’t mean that the IBA1 antibody won’t work, just that we haven’t tested it. If you test one of our antibodies in a new species please let us know (positive or negative)!
What mounting media do you recommend to use with this antibody?
We recommend using one of our high performance mounting medias, supplied as either hardset or aqeous with a range of counterstains:
What counterstains do you recommend for use in ICC and IHC with this antibody?
We recommend using either DAPI or Hoechst 33342 to label cell nuclei. In some experiments it is also helpful to label actin filaments in the cytoskeleton using a Phalloidin conjugate such as FITC Phalloidin or Rhodamine Phalloidin-TRITC.
Antibody to IBA1 - calcium binding protein widely used as a marker for microglial cells. Part of the ValidAb™ range of highly validated, data-rich antibodies.


 Western Blot Protocol (1 MB)