Anti Visinin-Like Protein 1 (VLP1) antibody ValidAbTM
Alternative names
Visinin Like Protein 1, VILIP-1, VSNL1
Host
Mouse
Clonality
Monoclonal
Target
VLP1
Description
Antibody to Visinin-Like Protein 1 (VLP1) - calcium sensor protein and marker of neuronal damage. Part of the ValidAb™ range of highly validated, data-rich antibodies.
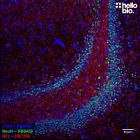
Figure 1. VLP1 expressing cultured rat hippocampal neurons stained by HB9013.
HB9013 stains Visinin-like protein 1 expressing culture rat hippocampal neurons. Method: neurons were cultured from E17-E18 rat embryos following established protocols (Martin and Henley, 2004. EMBO, 4749–4759) and fixed with 4% PFA on DIV21. Cells were permeabilized with 0.1% Triton X-100 followed by blocking in 1% BSA, 300mM glycine. HB9013 was incubated overnight (4°C) at a 1:1,000 dilution. This was followed by a one-hour incubation with polyclonal goat anti-mouse Dy550 secondary antibody (1:300 dilution). DAPI (HB0747) was used at 1µg/ml to visualize cell nuclei. For more detail please see our ICC protocol. Images were captured using a Leica SP8 AOBS confocal laser scanning microscope attached to a Leica DM I8 inverted epifluorescence microscope. The image was captured in Lightning deconvolution mode using a 40x objective (1.28x zoom), 405nm (1% power, PMT: 664V gain) and 561nm (0.5% power, Hyd: 16.5% gain) laser lines in a z-stack (0.32µm spacing). The stack was flattened using a maximum Z projection in ImageJ (Schindelin et al., 2012. Nat Methods, 9(7), 676–682).
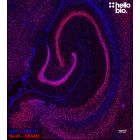
Figure 2. VLP1 positive staining in PFA fixed rat cerebellum sections
A section of rat cerebellum stained by HB9013 for VLP1. Method: Rat brains were dissected and fixed overnight in 4% PFA before then being incubated in 30% sucrose (in PBS) until sunk (approx. 48hrs). A freezing microtome was used to cut 40µm horizontal slices before sections were incubated in 1% NaBH4 for 15 minutes. Sections were blocked in 0.05M glycine, 2% BSA and 3% donkey serum before incubation overnight in HB9013 (1µg/ml, 1:1000). This was followed by a two-hour incubation with goat anti-mouse AF488 secondary antibody (1:300). DAPI (HB0747) was used at 1µg/ml to visualize cell nuclei. For more detail please see our IHC(IF) protocol. Images were captured using a Leica DMI6000B inverted epifluorescence microscope attached to a Photometric Prime 95B camera. The image was captured as a z-stack (0.3µm interval) using a 40x objective with DAP (20ms exposure) and L5 filters (15ms exposure). The stack was flattened using a maximum Z projection in ImageJ (Schindelin et al., 2012. Nat Methods, 9(7), 676–682).
Figure 3. βIII Tubulin and VLP1 staining patterns in cultured rat hippocampal neurons.
HB9013 stains Visinin-like protein 1 expressing neurons while HB8947 stains βIII tubulin expressing neurons in a cultured rat hippocampal neuron preparation. Method: neurons were cultured from E17-E18 rat embryos following established protocols (Martin and Henley, 2004. EMBO, 4749–4759) and fixed with 4% PFA on DIV21. Cells were permeabilized with 0.1% Triton X-100 followed by blocking in 1% BSA, 300mM glycine. HB9013 and HB8947 were incubated overnight (4°C) both at a 1:1,000 dilution. This was followed by a one-hour incubation with polyclonal goat anti-mouse Dy550 and polyclonal goat anti-chicken AF488 secondary antibodies (both 1:300 dilution). DAPI (HB0747) was used at 1µg/ml to visualize cell nuclei. For more detail please see our ICC protocol. Images were captured using a Leica DMI6000B inverted epifluorescence microscope attached to a Photometric Prime 95B camera. The image was captured as a tilescan and z-stack (0.3µm interval) using a 40x objective and DAP (5ms exposure), L5 (25ms exposure), and RHO filters (10ms exposure). The stack was flattened using a maximum Z projection in ImageJ (Schindelin et al., 2012. Nat Methods, 9(7), 676–682).
Figure 4. VLP1 expression in various tissue lysates and preparations.
HB9013 revealed the ≈24kDa band associated with VLP1 only in neural tissue samples with there also being a faint unidentified 30kDa band. Method: mouse brain and rat brain membrane (P2) and cytosol fractions were prepared following previous work (Molnar et al., 1993. Neuroscience 53:307-326) from freshly collected adult brains. Other tissue lysates were prepared following established protocols from freshly dissected tissue (see our guide on WB sample preparation). Samples were loaded (20µg / lane) onto a 4-20% acrylamide gel alongside a protein ladder (HB9198) before being run at 140V for 45 minutes. Wet transfer to a PVDF membrane was completed in 90 minutes using 400mA. The membrane was blocked for 2hrs in 5% non-fat dry milk before being incubated overnight at 4°C in HB9198 at a 1:1,000 dilution. Following washing, the membrane was incubated in secondary antibody (1:10,000 dilution, Polyclonal donkey anti-mouse HRP conjugated) for 2hrs. For more detail please see our Western blotting protocol. Detection was accomplished using ECL substrate 5and a Licor Odyssey Fc imaging system. Following imaging, the membrane was stripped with two changes of stripping buffer (HB7756) before being washed, blocked for 2 hours in 5% non-fat dry milk and incubated in HB9177 (mouse monoclonal anti-GAPDH, 1:4,000 dilution, 0.25µg/ml) overnight at 4°C. Following washing, the membrane was incubated in a 1:10,000 dilution of a polyclonal goat anti-mouse HRP conjugated secondary antibody for 2hrs and visualized again using ECL substrate and a Licor Odyssey Fc imaging system.
Figure 5. Concentration response of HB9013 staining in rat cerebellum.
HB9013 produces clear VLP1 staining at concentrations as low as 0.125µg/ml (1:8,000 dilution) in rat cerebellar sections. Method: Rat brains were dissected and fixed overnight in 4% PFA before then being incubated in 30% sucrose (in PBS) until sunk (approx. 48hrs). A freezing microtome was used to cut 40µm horizontal slices before sections were incubated in 1% NaBH4 for 15 minutes. Sections were blocked in 0.05M glycine, 2% BSA and 3% donkey serum before incubation overnight in HB9013 (1:1000 to 1:8,000 dilutions | 0.125 - 1µg/ml). This was followed by a two-hour incubation with goat anti-mouse AF488 secondary antibody (1:300). DAPI (HB0747) was used at 1µg/ml to visualize cell nuclei. For more detail please see our IHC(IF) protocol. Images were captured using a Leica DMI6000B inverted epifluorescence microscope attached to a Photometric Prime 95B camera. The images were captured as a z-stack using a 20x objective and all using the same exposure setting (DAP: 30ms, L5: 100ms). Stacks were flattened using a maximum Z projection in ImageJ (Schindelin et al., 2012. Nat Methods, 9(7), 676–682) before being constructed into a montage.
Figure 6. VLP1 expressing cultured rat hippocampal neurons stained by HB9013.
HB9013 stains Visinin-like protein 1 expressing culture rat hippocampal neurons. Method: neurons were cultured from E17-E18 rat embryos following established protocols (Martin and Henley, 2004. EMBO, 4749–4759) and fixed with 4% PFA on DIV21. Cells were permeabilized with 0.1% Triton X-100 followed by blocking in 1% BSA, 300mM glycine. HB9013 was incubated overnight (4°C) at a 1:1,000 dilution. This was followed by a one hour incubation with polyclonal goat anti-mouse Dy550 secondary antibody (1:300 dilution). DAPI (HB0747) was used at 1µg/ml to visualize cell nuclei. For more detail please see our ICC protocol. Images were captured using a Leica SP8 AOBS confocal laser scanning microscope attached to a Leica DM I8 inverted epifluorescence microscope. Images were captured using a Leica SP8 AOBS confocal laser scanning microscope attached to a Leica DM I8 inverted epifluorescence microscope. The image was captured in Lightning deconvolution mode using a 63x objective (1.28x zoom), 405nm (1% power, PMT: 666V gain) and 561nm (0.5% power, Hyd: 14.1% gain) laser lines in a z-stack (0.27µm spacing). The stack was flattened using a maximum Z projection in ImageJ (Schindelin et al., 2012. Nat Methods, 9(7), 676–682).
Figure 7. Concentration response of HB9013 staining in a rat brain cytosol preparation.
HB9013 shows strong affinity for GFAP with bands visible at as low as a 1 in 16,000 dilution. Method: cytosol fractions were prepared from fresh rat brains following established protocols (Molnar et al., 1993. Neuroscience 53:307-326). Rat cytosol samples were loaded (20µg / lane) onto a 4-20% acrylamide gel alongside a protein ladder (HB9198) before being run at 140V for 45 minutes. Wet transfer to a PVDF membrane was completed in 90 minutes using 400mA. Following transfer, the membrane was cut into strips using Ponceau dye to visualize and cut individual lanes. Strips were blocked for 2hrs in 5% non-fat dry milk before being incubated overnight at 4°C in HB9013. Each strip was incubated separately with a separate HB9013 concentration with this ranging from 1:1000 to 1:16,000 dilutions. Following washing, the membrane was incubated in secondary antibody (1:10,000 dilution, Polyclonal goat anti-mouse HRP conjugated) for 2hrs. For more detail please see our Western blotting protocol. Detection was accomplished using ECL substrate and a Licor Odyssey Fc imaging system. Band intensity was calculated using Image Studio version 5.2.5 (LiCor) and a graph was constructed in GraphPad Prism 9 using a 3-parameter Hill equation curve fit.
Figure 8. βIII Tubulin and VLP1 staining patterns in cultured rat hippocampal neurons.
HB9013 stains Visinin-like protein 1 expressing neurons while HB8947 stains βIII tubulin expressing neurons in a cultured rat hippocampal neuron preparation. Method: neurons were cultured from E17-E18 rat embryos following established protocols (Martin and Henley, 2004. EMBO, 4749–4759) and fixed with 4% PFA on DIV21. Cells were permeabilized with 0.1% Triton X-100 followed by blocking in 1% BSA, 300mM glycine. HB9013 and HB8947 were incubated overnight (4°C) both at a 1:1,000 dilution. This was followed by a one-hour incubation with polyclonal goat anti-mouse Dy550 and polyclonal goat anti-chicken AF488 secondary antibodies (both 1:300 dilution). DAPI (HB0747) was used at 1µg/ml to visualize cell nuclei. For more detail please see our ICC protocol. Images were captured using a Leica DMI6000B inverted epifluorescence microscope attached to a Photometric Prime 95B camera. The image was captured as a tilescan and z-stack (0.3µm interval) using a 40x objective and DAP (5ms exposure), L5 (25ms exposure), and RHO filters (10ms exposure). The stack was flattened using a maximum Z projection in ImageJ (Schindelin et al., 2012. Nat Methods, 9(7), 676–682).
Figure 1. VLP1 expressing cultured rat hippocampal neurons stained by HB9013.
HB9013 stains Visinin-like protein 1 expressing culture rat hippocampal neurons. Method: neurons were cultured from E17-E18 rat embryos following established protocols (Martin and Henley, 2004. EMBO, 4749–4759) and fixed with 4% PFA on DIV21. Cells were permeabilized with 0.1% Triton X-100 followed by blocking in 1% BSA, 300mM glycine. HB9013 was incubated overnight (4°C) at a 1:1,000 dilution. This was followed by a one-hour incubation with polyclonal goat anti-mouse Dy550 secondary antibody (1:300 dilution). DAPI (HB0747) was used at 1µg/ml to visualize cell nuclei. For more detail please see our ICC protocol. Images were captured using a Leica SP8 AOBS confocal laser scanning microscope attached to a Leica DM I8 inverted epifluorescence microscope. The image was captured in Lightning deconvolution mode using a 40x objective (1.28x zoom), 405nm (1% power, PMT: 664V gain) and 561nm (0.5% power, Hyd: 16.5% gain) laser lines in a z-stack (0.32µm spacing). The stack was flattened using a maximum Z projection in ImageJ (Schindelin et al., 2012. Nat Methods, 9(7), 676–682).
Figure 2. VLP1 positive staining in PFA fixed rat cerebellum sections
A section of rat cerebellum stained by HB9013 for VLP1. Method: Rat brains were dissected and fixed overnight in 4% PFA before then being incubated in 30% sucrose (in PBS) until sunk (approx. 48hrs). A freezing microtome was used to cut 40µm horizontal slices before sections were incubated in 1% NaBH4 for 15 minutes. Sections were blocked in 0.05M glycine, 2% BSA and 3% donkey serum before incubation overnight in HB9013 (1µg/ml, 1:1000). This was followed by a two-hour incubation with goat anti-mouse AF488 secondary antibody (1:300). DAPI (HB0747) was used at 1µg/ml to visualize cell nuclei. For more detail please see our IHC(IF) protocol. Images were captured using a Leica DMI6000B inverted epifluorescence microscope attached to a Photometric Prime 95B camera. The image was captured as a z-stack (0.3µm interval) using a 40x objective with DAP (20ms exposure) and L5 filters (15ms exposure). The stack was flattened using a maximum Z projection in ImageJ (Schindelin et al., 2012. Nat Methods, 9(7), 676–682).
Figure 3. βIII Tubulin and VLP1 staining patterns in cultured rat hippocampal neurons.
HB9013 stains Visinin-like protein 1 expressing neurons while HB8947 stains βIII tubulin expressing neurons in a cultured rat hippocampal neuron preparation. Method: neurons were cultured from E17-E18 rat embryos following established protocols (Martin and Henley, 2004. EMBO, 4749–4759) and fixed with 4% PFA on DIV21. Cells were permeabilized with 0.1% Triton X-100 followed by blocking in 1% BSA, 300mM glycine. HB9013 and HB8947 were incubated overnight (4°C) both at a 1:1,000 dilution. This was followed by a one-hour incubation with polyclonal goat anti-mouse Dy550 and polyclonal goat anti-chicken AF488 secondary antibodies (both 1:300 dilution). DAPI (HB0747) was used at 1µg/ml to visualize cell nuclei. For more detail please see our ICC protocol. Images were captured using a Leica DMI6000B inverted epifluorescence microscope attached to a Photometric Prime 95B camera. The image was captured as a tilescan and z-stack (0.3µm interval) using a 40x objective and DAP (5ms exposure), L5 (25ms exposure), and RHO filters (10ms exposure). The stack was flattened using a maximum Z projection in ImageJ (Schindelin et al., 2012. Nat Methods, 9(7), 676–682).
Figure 4. VLP1 expression in various tissue lysates and preparations.
HB9013 revealed the ≈24kDa band associated with VLP1 only in neural tissue samples with there also being a faint unidentified 30kDa band. Method: mouse brain and rat brain membrane (P2) and cytosol fractions were prepared following previous work (Molnar et al., 1993. Neuroscience 53:307-326) from freshly collected adult brains. Other tissue lysates were prepared following established protocols from freshly dissected tissue (see our guide on WB sample preparation). Samples were loaded (20µg / lane) onto a 4-20% acrylamide gel alongside a protein ladder (HB9198) before being run at 140V for 45 minutes. Wet transfer to a PVDF membrane was completed in 90 minutes using 400mA. The membrane was blocked for 2hrs in 5% non-fat dry milk before being incubated overnight at 4°C in HB9198 at a 1:1,000 dilution. Following washing, the membrane was incubated in secondary antibody (1:10,000 dilution, Polyclonal donkey anti-mouse HRP conjugated) for 2hrs. For more detail please see our Western blotting protocol. Detection was accomplished using ECL substrate 5and a Licor Odyssey Fc imaging system. Following imaging, the membrane was stripped with two changes of stripping buffer (HB7756) before being washed, blocked for 2 hours in 5% non-fat dry milk and incubated in HB9177 (mouse monoclonal anti-GAPDH, 1:4,000 dilution, 0.25µg/ml) overnight at 4°C. Following washing, the membrane was incubated in a 1:10,000 dilution of a polyclonal goat anti-mouse HRP conjugated secondary antibody for 2hrs and visualized again using ECL substrate and a Licor Odyssey Fc imaging system.
Figure 5. Concentration response of HB9013 staining in rat cerebellum.
HB9013 produces clear VLP1 staining at concentrations as low as 0.125µg/ml (1:8,000 dilution) in rat cerebellar sections. Method: Rat brains were dissected and fixed overnight in 4% PFA before then being incubated in 30% sucrose (in PBS) until sunk (approx. 48hrs). A freezing microtome was used to cut 40µm horizontal slices before sections were incubated in 1% NaBH4 for 15 minutes. Sections were blocked in 0.05M glycine, 2% BSA and 3% donkey serum before incubation overnight in HB9013 (1:1000 to 1:8,000 dilutions | 0.125 - 1µg/ml). This was followed by a two-hour incubation with goat anti-mouse AF488 secondary antibody (1:300). DAPI (HB0747) was used at 1µg/ml to visualize cell nuclei. For more detail please see our IHC(IF) protocol. Images were captured using a Leica DMI6000B inverted epifluorescence microscope attached to a Photometric Prime 95B camera. The images were captured as a z-stack using a 20x objective and all using the same exposure setting (DAP: 30ms, L5: 100ms). Stacks were flattened using a maximum Z projection in ImageJ (Schindelin et al., 2012. Nat Methods, 9(7), 676–682) before being constructed into a montage.
Figure 6. VLP1 expressing cultured rat hippocampal neurons stained by HB9013.
HB9013 stains Visinin-like protein 1 expressing culture rat hippocampal neurons. Method: neurons were cultured from E17-E18 rat embryos following established protocols (Martin and Henley, 2004. EMBO, 4749–4759) and fixed with 4% PFA on DIV21. Cells were permeabilized with 0.1% Triton X-100 followed by blocking in 1% BSA, 300mM glycine. HB9013 was incubated overnight (4°C) at a 1:1,000 dilution. This was followed by a one hour incubation with polyclonal goat anti-mouse Dy550 secondary antibody (1:300 dilution). DAPI (HB0747) was used at 1µg/ml to visualize cell nuclei. For more detail please see our ICC protocol. Images were captured using a Leica SP8 AOBS confocal laser scanning microscope attached to a Leica DM I8 inverted epifluorescence microscope. Images were captured using a Leica SP8 AOBS confocal laser scanning microscope attached to a Leica DM I8 inverted epifluorescence microscope. The image was captured in Lightning deconvolution mode using a 63x objective (1.28x zoom), 405nm (1% power, PMT: 666V gain) and 561nm (0.5% power, Hyd: 14.1% gain) laser lines in a z-stack (0.27µm spacing). The stack was flattened using a maximum Z projection in ImageJ (Schindelin et al., 2012. Nat Methods, 9(7), 676–682).
Figure 7. Concentration response of HB9013 staining in a rat brain cytosol preparation.
HB9013 shows strong affinity for GFAP with bands visible at as low as a 1 in 16,000 dilution. Method: cytosol fractions were prepared from fresh rat brains following established protocols (Molnar et al., 1993. Neuroscience 53:307-326). Rat cytosol samples were loaded (20µg / lane) onto a 4-20% acrylamide gel alongside a protein ladder (HB9198) before being run at 140V for 45 minutes. Wet transfer to a PVDF membrane was completed in 90 minutes using 400mA. Following transfer, the membrane was cut into strips using Ponceau dye to visualize and cut individual lanes. Strips were blocked for 2hrs in 5% non-fat dry milk before being incubated overnight at 4°C in HB9013. Each strip was incubated separately with a separate HB9013 concentration with this ranging from 1:1000 to 1:16,000 dilutions. Following washing, the membrane was incubated in secondary antibody (1:10,000 dilution, Polyclonal goat anti-mouse HRP conjugated) for 2hrs. For more detail please see our Western blotting protocol. Detection was accomplished using ECL substrate and a Licor Odyssey Fc imaging system. Band intensity was calculated using Image Studio version 5.2.5 (LiCor) and a graph was constructed in GraphPad Prism 9 using a 3-parameter Hill equation curve fit.
Figure 8. βIII Tubulin and VLP1 staining patterns in cultured rat hippocampal neurons.
HB9013 stains Visinin-like protein 1 expressing neurons while HB8947 stains βIII tubulin expressing neurons in a cultured rat hippocampal neuron preparation. Method: neurons were cultured from E17-E18 rat embryos following established protocols (Martin and Henley, 2004. EMBO, 4749–4759) and fixed with 4% PFA on DIV21. Cells were permeabilized with 0.1% Triton X-100 followed by blocking in 1% BSA, 300mM glycine. HB9013 and HB8947 were incubated overnight (4°C) both at a 1:1,000 dilution. This was followed by a one-hour incubation with polyclonal goat anti-mouse Dy550 and polyclonal goat anti-chicken AF488 secondary antibodies (both 1:300 dilution). DAPI (HB0747) was used at 1µg/ml to visualize cell nuclei. For more detail please see our ICC protocol. Images were captured using a Leica DMI6000B inverted epifluorescence microscope attached to a Photometric Prime 95B camera. The image was captured as a tilescan and z-stack (0.3µm interval) using a 40x objective and DAP (5ms exposure), L5 (25ms exposure), and RHO filters (10ms exposure). The stack was flattened using a maximum Z projection in ImageJ (Schindelin et al., 2012. Nat Methods, 9(7), 676–682).
Product information
Immunogen
Human full-length VLP1 expressed in and purified from E. coli
Clone number
2D11
Isotype
IgG1
Purification
Protein G affinity chromatography
Concentration
1mg/ml
Formulation
50% PBS, 50% glycerol + 5mM sodium azide
Predicted species reactivity
Mouse, Rat, Human, Chicken
Tested species reactivity
Mouse, Rat
Tested applications
Applications
ICC, WB, IHC(IF)
Western blot optimal concentration
0.5µg/ml (1:2,000) as tested in a rat brain cytosol preparation.
IHC(IF) optimal concentration
0.25µg/ml (1:4,000), as tested in PFA fixed horizontal rat brain cerebellum sections
ICC optimal concentration
0.25µg/ml (1:4,000), as tested in cultured rat hippocampal neurons.
Positive control
Tissue from the brain, especially the retina or cerebellum form an excellent positive control.
Negative control
VLP1 is expressed widely throughout a range of tissues in the body therefore a cell line such as HEK293T forms the best negative control.
VLP1 has no major isoforms other than the canonical sequence
Expression
Visinin-like protein 1 (VLP1) is found exclusively within the neurons of the nervous system, where it has abundant expression. While present throughout the nervous system, the specific levels of its expression vary between different neuronal populations with particularly strong expression in cerebellar granule cells.
Subcellular expression
VLP1 is localized to the neuronal cytosol during periods of low activity where Ca2+ concentrations are low but then translocates and associates with both membranes of organelles and the cell membrane during periods of high neuronal firing when Ca2+ is elevated
Target function
VLP1 functions primarily as a neuronal calcium sensor protein, equipped with a myristoylation-consensus sequence and four EF-hand motifs that enable a Ca2+-myristoyl switch for calcium-dependent membrane targeting and dimerization. This mechanism allows VLP1 to modulate intracellular signaling pathways, particularly in the central nervous system. In the brain, VLP1 is implicated in calcium-mediated neuronal injury and its elevated levels in cerebrospinal fluid serve as a biomarker for neuronal damage in conditions such as Alzheimer's disease, stroke, and general brain injury. Beyond the nervous system, VLP1 is expressed in various other tissues and notably acts as a target gene of the Wnt/β-catenin signaling pathway, contributing to apoptosis resistance in colorectal cancer cells, a role that also depends on its myristoylation, Ca2+-binding, and dimerization.
Post translational modifications
VLP1 is subject to removal of the initial methionine and there have been reports of ubiquitination on residues 18 and 63.
Homology (compared to human)
Mouse and rat VLP1 have 99.48% homology with human VLP1 due to a single base change (A to V at position 104)
Similar proteins
Hippocalcin-like protein 4 (HLP4) is the most similar human protein to VLP1 (89.5% identity) with other proteins having <70% similarity scores.
Storage & Handling
Storage instructions
-20°C
Shipping Conditions
Stable for ambient temperature shipping. Follow storage instructions on receipt.
Storage of solutions
Prepare and use solutions on the same day if possible. Store solutions at -20°C for up to one month if storage is required. Equilibrate to RT and ensure the solution is precipitate free before use.
Important
This product is for RESEARCH USE ONLY and is not intended for therapeutic or diagnostic use. Not for human or veterinary use
What guarantee do you have that my VLP1 antibody will perform as expected?
We guarantee that your VLP1 antibody will work for the applications and species we list on the datasheet. If the antibody fails to perform as expected then we are happy to offer a 100% refund guarantee. For more details please see our guarantee policy.
Will my VLP1 antibody work against species that have not been listed on the datasheet?
A species not being listed doesn’t mean that the antibody won’t work, just that we haven’t tested it. If you test one of our antibodies in a new species please let us know (positive or negative)!
What protocols are available for use with this VLP1 antibody
We have made a comprehensive collection of protocols that we have used in our experiments to validate this VLP1 antibody.
What counterstains do you recommend for use in ICC and IHC with this VLP1 antibody?
We recommend using either DAPI or Hoechst 33342 to label cell nuclei. In some experiments it is also helpful to label actin filaments in the cytoskeleton using a Phalloidin conjugate such as FITC Phalloidin or Rhodamine Phalloidin-TRITC.
What mounting media do you recommend to use with this antibody?
We recommend using one of our high performance mounting medias, supplied as either hardset or aqeous with a range of counterstains:
References for Anti Visinin-Like Protein 1 (VLP1) antibody ValidAbTM
References are publications that support the biological activity of the product
Visinin-like protein 1 levels in blood and CSF as emerging markers for Alzheimer's and other neurodegenerative diseases.
Halbgebauer S, Steinacker P, Riedel D, Oeckl P, Anderl-Straub S, Lombardi J, von Arnim CAF, Nagl M, Giese A, Ludolph AC, Otto M. (2022 ) Alzheimers Res Ther. :
Antibody to Visinin-Like Protein 1 (VLP1) - calcium sensor protein and marker of neuronal damage. Part of the ValidAb™ range of highly validated, data-rich antibodies.


 Western Blot Protocol (1 MB)