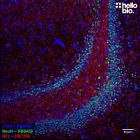
Figure 1. α-Synuclein staining in rat cerebellum localises to the molecular layer.
Rat cerebellum stained with HB6378 for α-synuclein and HB6498 for NeuN (rabbit polyclonal). Method: Rat brains were dissected and fixed overnight in 4% PFA before then being incubated in 30% sucrose (in PBS) until sunk (approx. 48hrs). A freezing microtome was used to cut 40µm horizontal slices before sections were incubated in 1% NaBH4 for 30 minutes. Sections were blocked in 0.05M glycine, 2% BSA and 3% donkey serum before incubation overnight in HB6378 (1:1000 dilution, 1µg/ml) and HB6498 (1:2000 dilution, 0.5µg/ml). This was followed by a two hour incubation with secondary antibodies at a 1:300 dilution (polyclonal goat anti-mouse Janelia Fluor 549, HB8556 and goat anti-rabbit DyLight 650, Thermofisher 11804574). DAPI (HB0747) was used at 1µg/ml to visualise cell nuclei. For more detail please see our IHC(IF) protocol. Images were captured using a Leica DMI6000B inverted epifluorescence microscope connected to a Photometric Prime 95B camera. The image was captured as a tilescan using a 10x objective (A4: 30ms, Y3: 178, Y5: 247ms exposures) in a z-stack (3.8µm spacing). The image was deconvolved in Huygens professional software before the stack was flattened using a maximum Z projection in ImageJ (Schindelin et al., 2012. Nat Methods, 9(7), 676–682).
Figure 2. α-Synuclein staining in rat hippocampus.
Rat hippocampus stained with HB6378 for α-synuclein and HB6498 for NeuN (rabbit polyclonal). Method: Rat brains were dissected and fixed overnight in 4% PFA before then being incubated in 30% sucrose (in PBS) until sunk (approx. 48hrs). A freezing microtome was used to cut 40µm horizontal slices before sections were incubated in 1% NaBH4 for 30 minutes. Sections were blocked in 0.05M glycine, 2% BSA and 3% donkey serum before incubation overnight in HB6378 (1:1000 dilution, 1µg/ml) and HB6498 (1:5000 dilution, 0.2µg/ml). This was followed by a two hour incubation with secondary antibodies at a 1:300 dilution (polyclonal goat anti-mouse DyLight 488 and polyclonal goat anti-rabbit Janelia Fluor 594). DAPI (HB0747) was used at 1µg/ml to visualise cell nuclei. For more detail please see our IHC(IF) protocol. Images were captured using a Leica DMI6000B inverted epifluorescence microscope connected to a Photometric Prime 95B camera. The image was captured as a tilescan using a 10x objective (A4: 68ms, L5: 276ms, Y3: 484ms exposures) in a z-stack (5µm spacing). The image was deconvolved in Huygens professional software before the stack was flattened using a maximum Z projection in ImageJ (Schindelin et al., 2012. Nat Methods, 9(7), 676–682).
Figure 3. α-Synuclein staining in rat dentate gyrus
Rat dentate gyrus stained with HB6378 for α-synuclein and HB6498 for NeuN (rabbit polyclonal). Method: Rat brains were dissected and fixed overnight in 4% PFA before then being incubated in 30% sucrose (in PBS) until sunk (approx. 48hrs). A freezing microtome was used to cut 40µm horizontal slices before sections were incubated in 1% NaBH4 for 30 minutes. Sections were blocked in 0.05M glycine, 2% BSA and 3% donkey serum before incubation overnight in HB6378 (1:1000 dilution, 1µg/ml) and HB6498 (1:5000 dilution, 0.2µg/ml). This was followed by a two hour incubation with secondary antibodies at a 1:300 dilution (polyclonal goat anti-mouse DyLight 488 and Goat anti-rabbit DyLight 594). DAPI (HB0747) was used at 1µg/ml to visualise cell nuclei. For more detail please see our IHC(IF) protocol. Images were captured using a Leica SP8 AOBS confocal laser scanning microscope attached to a Leica DM I8 inverted epifluorescence microscope. The image was captured in Lightning deconvolution mode using a 63x objective (1.28x zoom), 405nm (10.0% power, PMT: 593V gain), 496nm (5.6% power, Hyd: 35.1% gain) and 561nm (5.5% power, Hyd: 12.7% gain) laser lines in a z-stack (0.37µm spacing). The stack was flattened using a maximum Z projection in ImageJ (Schindelin et al., 2012. Nat Methods, 9(7), 676–682).
Figure 4. HB6378 staining of native preparations and recombinant α-synuclein.
(A) Western Blot of different loading quantities of recombinant α-synuclein alongside native brain samples showing detection of recombinant α-synuclein down to 3ng/lane.(B) The membrane was then cut in half and reimaged at a higher exposure enabling the visualization of α-synuclein bands in native tissue. Method: mouse brain and rat brain membrane (P2) and cytosol fractions were prepared following previous work (Molnar et al., 1993. Neuroscience 53:307-326) from freshly collected adult brains. Recombinant α-synuclein was purchased from Biorbyt. Native samples were loaded at 20µg / lane of total protein alongside a concentration series of recombinant protein onto a 4-20% acrylamide gel alongside a protein ladder (NEB Prestained protein standard, P7718S) before being run at 180V for 50 minutes. Wet transfer to a PVDF membrane was completed in 90 minutes using 400mA. The membrane was blocked for 2hrs in 5% non-fat dry milk before being incubated overnight at 4°C in HB6378 at a 1:1,000 dilution (1µg/ml). Following washing, the membrane was incubated in secondary antibody (1:10,000 dilution, Polyclonal goat anti-mouse HRP conjugated, Sigma, A3682) for 2hrs. For more detail please see our Western blotting protocol. Detection was accomplished using Sigma Forte ECL substrate and a Licor Odyssey Fc imaging system (ECL channel: 5 min exposure, 700nm channel: 30 sec exposure). Following imaging the membrane was stripped with two changes of stripping buffer (HB7756) before being washed, blocked for 2 hours in 5% non-fat dry milk and incubated in HB9177 (mouse monoclonal anti-GAPDH, 1:4,000 dilution, 0.25µg/ml) overnight at 4°C. Following washing the membrane was incubated in a 1:10,000 dilution of a polyclonal goat anti-mouse HRP conjugated secondary antibody (Sigma Aldrich A3682) for 2hrs and visualized using Clarity Western ECL substrate (BioRad, 1705061) and a Licor Odyssey Fc imaging system (ECL channel: 4 min exposure, 700nm channel: 30 sec exposure).
Figure 5. α-Synuclein, NeuN and GFAP staining in rat cerebellum
Rat cerebellum stained with HB6378 for α-synuclein, HB6406 for GFAP and HB6498 for NeuN (rabbit polyclonal). Method: Rat brains were dissected and fixed overnight in 4% PFA before then being incubated in 30% sucrose (in PBS) until sunk (approx. 48hrs). A freezing microtome was used to cut 40µm horizontal slices before sections were incubated in 1% NaBH4 for 30 minutes. Sections were blocked in 0.05M glycine, 2% BSA and 3% donkey serum before incubation overnight in HB6378 (1:1000 dilution, 1µg/ml), HB6406 (1:2000 dilution) and HB6498 (1:2000 dilution). This was followed by a two hour incubation with secondary antibodies at a 1:300 dilution (polyclonal donkey anti-chicken Alexa Fluor 488, Thermofisher A78948; polyclonal goat anti-mouse Janelia Fluor 549; Goat anti-rabbit DyLight 650, Thermofisher 11804574). DAPI (HB0747) was used at 1µg/ml to visualise cell nuclei. For more detail please see our IHC(IF) protocol. Images were captured using a Leica SP8 AOBS confocal laser scanning microscope attached to a Leica DM I8 inverted epifluorescence microscope. The image was captured in Lightning deconvolution mode using a 20x objective (1.28x zoom), 405nm (1% power, PMT: 623V gain), 488nm (2% power, Hyd: 33% gain) and 633nm (1% power, Hyd: 20% gain) laser lines in a z-stack (2.9µm spacing). The stack was flattened using a maximum Z projection in ImageJ (Schindelin et al., 2012. Nat Methods, 9(7), 676–682).
Figure 6. α-Synuclein staining in cultured rat cortical neurons.
HB6378 staining of cultured rat neurons for α-synuclein with HB7266 counterstain (rabbit monoclonal anti-NfL). Method: neurones were cultured from E17-E18 rat embryos following established protocols (Martin and Henley, 2004. EMBO, 4749–4759) and fixed with 4% PFA on DIV21. Cells were permeabilised with 0.1% Triton X-100 followed by blocking in 1% BSA, 300mM glycine. HB6378 was incubated overnight (4°C) at a 1:1000 dilution while HB7266 was applied at a 1:2,000 dilution. This was followed by a one-hour incubation with secondary antibodies (polyclonal goat anti-mouse DyLight 550 conjugated and polyclonal goat anti-rabbit DyLight 488 conjugated secondary antibodies both at a 1:300 dilution). DAPI (HB0747) was used at 1µg/ml to visualise cell nuclei. For more detail please see our ICC protocol. Images were captured using a Leica DMI6000B inverted epifluorescence microscope connected to a Photometric Prime 95B camera. The image was captured Using a 40x objective (DAP: 15ms, L5: 22ms, RHO: 10ms) in a z-stack (0.53µm spacing). The image was deconvolved in Huygens professional software before the stack was flattened using a maximum Z projection in ImageJ (Schindelin et al., 2012. Nat Methods, 9(7), 676–682).
Figure 7. α-Synuclein staining in mitoDsRed transfected cultured rat hippocampal neurons.
HB6378 staining of rat neurons sparsely transfected with mitoDsRed (please note only some neurons are transfected). Method: neurones were cultured from E17-E18 rat embryos following established protocols (Martin and Henley, 2004. EMBO, 4749–4759) and fixed with 4% PFA on DIV21. Neurons were transfected with a plasmid containing mitoDsRed following established protocols. Cells were permeabilised with 0.1% Triton X-100 followed by blocking in 1% BSA, 300mM glycine. HB6378 was incubated overnight (4°C) at a 1:500 dilution followed by a one hour incubation with a polyclonal goat anti-mouse DyLight 488 conjugated secondary antibody (1:300 dilution). DAPI (HB0747) was used at 1µg/ml to visualise cell nuclei. For more detail please see our ICC protocol. Images were captured using a Leica DMI6000B inverted epifluorescence microscope connected to a Photometric Prime 95B camera. The image was captured Using a 40x objective (DAP: 57ms, L5: 268ms, TX2: 20ms) in a z-stack (1.0µm spacing). The image was deconvolved in Huygens professional software before the stack was flattened using a maximum Z projection in ImageJ (Schindelin et al., 2012. Nat Methods, 9(7), 676–682).
Figure 8. α-Synuclein staining in rat hippocampal CA1
Rat hippocampus CA1 stained with HB6378 for α-synuclein and HB6498 for NeuN (rabbit polyclonal). Method: Rat brains were dissected and fixed overnight in 4% PFA before then being incubated in 30% sucrose (in PBS) until sunk (approx. 48hrs). A freezing microtome was used to cut 40µm horizontal slices before sections were incubated in 1% NaBH4 for 30 minutes. Sections were blocked in 0.05M glycine, 2% BSA and 3% donkey serum before incubation overnight in HB6378 (1:1000 dilution, 1µg/ml) and HB6498 (1:5000 dilution, 0.2µg/ml). This was followed by a two hour incubation with secondary antibodies at a 1:300 dilution (polyclonal goat anti-mouse DyLight 488 and Goat anti-rabbit DyLight 594). DAPI (HB0747) was used at 1µg/ml to visualise cell nuclei. For more detail please see our IHC(IF) protocol. Images were captured using a Leica DMI6000B inverted epifluorescence microscope connected to a Photometric Prime 95B camera. The image was captured as a tilescan using a 10x objective (A4: 68ms, L5: 276ms, Y3: 484ms exposures) in a z-stack (5µm spacing). The image was deconvolved in Huygens professional software before the stack was flattened using a maximum Z projection in ImageJ (Schindelin et al., 2012. Nat Methods, 9(7), 676–682).
Figure 9. α-Synuclein staining in cultured rat cortical neurons.
HB6378 staining of cultured rat neurons for α-synuclein with HB7266 counterstain (rabbit monoclonal anti-NfL). Method: neurones were cultured from E17-E18 rat embryos following established protocols (Martin and Henley, 2004. EMBO, 4749–4759) and fixed with 4% PFA on DIV21. Cells were permeabilised with 0.1% Triton X-100 followed by blocking in 1% BSA, 300mM glycine. HB6378 was incubated overnight (4°C) at a 1:1000 dilution while HB7266 was applied at a 1:2,000 dilution. This was followed by a one-hour incubation with secondary antibodies (polyclonal goat anti-mouse DyLight 550 conjugated and polyclonal goat anti-rabbit DyLight 488 conjugated secondary antibodies both at a 1:300 dilution). DAPI (HB0747) was used at 1µg/ml to visualise cell nuclei. For more detail please see our ICC protocol. Images were captured using a Leica DMI6000B inverted epifluorescence microscope connected to a Photometric Prime 95B camera. The image was captured Using a 40x objective (DAP: 15ms, L5: 22ms, RHO: 10ms) in a z-stack (0.53µm spacing). The image was deconvolved in Huygens professional software before the stack was flattened using a maximum Z projection in ImageJ (Schindelin et al., 2012. Nat Methods, 9(7), 676–682).
Figure 10. Concentration response of HB6378 staining in rat cortex and cerebellum.
HB6378 produces strong staining of axon terminals in cortex and cerebellum. Method: Rat brains were dissected and fixed overnight in 4% PFA before then being incubated in 30% sucrose (in PBS) until sunk (approx. 48hrs). A freezing microtome was used to cut 40µm horizontal slices before sections were incubated in 1% NaBH4 for 15 minutes. Sections were blocked in 0.05M glycine, 2% BSA and 3% donkey serum before incubation overnight in HB6378 dilutions ranging from 1:1,000 to 1:8,000 (0.125 - 1µg/ml). This was followed by a two hour incubation with a polyclonal goat anti-mouse DyLight 488 secondary antibody at a 1:300 dilution. DAPI (HB0747) was used at 1µg/ml to visualise cell nuclei. For more detail please see our IHC(IF) protocol. Images were captured using a Leica DMI6000B inverted epifluorescence microscope connected to a Photometric Prime 95B camera as a z-stack with a 20x objective before being deconvolved in Huygens professional software and flattened using a maximum Z projection in ImageJ (Schindelin et al., 2012. Nat Methods, 9(7), 676–682).
HB6378 produces strong staining of axon terminals in cortex and cerebellum. Method: Rat brains were dissected and fixed overnight in 4% PFA before then being incubated in 30% sucrose (in PBS) until sunk (approx. 48hrs). A freezing microtome was used to cut 40µm horizontal slices before sections were incubated in 1% NaBH4 for 15 minutes. Sections were blocked in 0.05M glycine, 2% BSA and 3% donkey serum before incubation overnight in HB6378 dilutions ranging from 1:1,000 to 1:8,000 (0.125 - 1µg/ml). This was followed by a two hour incubation with a polyclonal goat anti-mouse DyLight 488 secondary antibody at a 1:300 dilution. DAPI (HB0747) was used at 1µg/ml to visualise cell nuclei. For more detail please see our IHC(IF) protocol. Images were captured using a Leica DMI6000B inverted epifluorescence microscope connected to a Photometric Prime 95B camera as a z-stack with a 20x objective before being deconvolved in Huygens professional software and flattened using a maximum Z projection in ImageJ (Schindelin et al., 2012. Nat Methods, 9(7), 676–682).
For all images DAPI exposure was constant at 20ms, exposure times for alpha synuclein (L5 filter) were as follows:
1:1,000: Cerebellum: 175ms; Cortex: 175ms
1:2,000: Cerebellum: 175ms; Cortex: 187ms
1:4,000: Cerebellum: 252ms; Cortex: 252ms
1:8,000: Cerebellum: 252ms, Cortex: 252ms
Figure 11. HB6378 staining in various tissue lysates and preparations
HB6378 revealed the ≈18.5kDa band associated with α-synuclein in neural tissue samples. There was however an unknown cross-reactivity observed in mouse liver samples. Method: mouse brain and rat brain membrane (P2) and cytosol fractions were prepared following previous work (Molnar et al., 1993. Neuroscience 53:307-326) from freshly collected adult brains. Other tissue lysates were prepared following established protocols from freshly dissected tissue (see our guide on WB sample preparation). Samples were loaded (20µg / lane) onto a 4-20% acrylamide gel alongside a protein ladder (NEB Prestained protein standard, P7718S) before being run at 150V for 59 minutes. Wet transfer to a PVDF membrane was completed in 90 minutes using 400mA. The membrane was blocked for 2hrs in 5% non-fat dry milk before being incubated overnight at 4°C in HB6378 at a 1:1,000 dilution (1µg/ml). Following washing, the membrane was incubated in secondary antibody (1:10,000 dilution, Polyclonal goat anti-mouse HRP conjugated, Sigma, A3682) for 2hrs. For more detail please see our Western blotting protocol. Detection was accomplished using Clarity Western ECL substrate (BioRad, 1705061) and a Licor Odyssey Fc imaging system (ECL channel: 6 min exposure, 700nm channel: 30 sec exposure). Following imaging the membrane was stripped with two changes of stripping buffer (HB7756) before being washed, blocked for 2 hours in 5% non-fat dry milk and incubated in HB9177 (mouse monoclonal anti-GAPDH, 1:4,000 dilution, 0.25µg/ml) overnight at 4°C. Following washing the membrane was incubated in a 1:10,000 dilution of a polyclonal goat anti-mouse HRP conjugated secondary antibody (Sigma Aldrich A3682) for 2hrs and visualised again using Clarity Western ECL substrate (BioRad, 1705061) and a Licor Odyssey Fc imaging system (ECL channel: 4 min exposure, 700nm channel: 30 sec exposure).
Figure 12. α-Synuclein staining in rat caudate putamen
Rat striatum stained with HB6378 for α-synuclein and HB6498 for NeuN (rabbit polyclonal). Method: Rat brains were dissected and fixed overnight in 4% PFA before then being incubated in 30% sucrose (in PBS) until sunk (approx. 48hrs). A freezing microtome was used to cut 40µm horizontal slices before sections were incubated in 1% NaBH4 for 30 minutes. Sections were blocked in 0.05M glycine, 2% BSA and 3% donkey serum before incubation overnight in HB6378 (1:1000 dilution, 1µg/ml) and HB6498 (1:2000 dilution, 0.5µg/ml). This was followed by a two hour incubation with secondary antibodies at a 1:300 dilution (polyclonal goat anti-mouse Janelia Fluor 549 and Goat anti-rabbit DyLight 650, Thermofisher 11804574). DAPI (HB0747) was used at 1µg/ml to visualise cell nuclei. For more detail please see our IHC(IF) protocol. Images were captured using a Leica DMI6000B inverted epifluorescence microscope connected to a Photometric Prime 95B camera. The image was captured as a tilescan using a 20x objective (A4: 31ms, Y3: 194ms, Y5: 373ms exposures) in a z-stack (2.4µm spacing). The image was deconvolved in Huygens professional software before the stack was flattened using a maximum Z projection in ImageJ (Schindelin et al., 2012. Nat Methods, 9(7), 676–682).
Product information
Immunogen
Human recombinant alpha-synuclein expressed in and purified from E. coli
Epitope
Localized to within residues 61 to 95 of human alpha-synuclein
Clone number
2A7
Isotype
IgG1
Purification
Protein A affinity chromatography
Concentration
1mg/ml
Formulation
50% PBS, 50% glycerol + 5mM sodium azide
Predicted species reactivity
Mouse, Rat, Human, Pig, Cow
Tested species reactivity
Mouse, Rat
Tested applications
Applications
ICC, IHC(IF)
IHC(IF) optimal concentration
1µg/ml (1:1,000) as tested in 4% PFA fixed rat brain slices
ICC optimal concentration
1µg/ml (1:1,000) as tested in cultured rat hippocampal neurons
Positive control
Any neural tissue will express α-Synuclein in the presynaptic terminals of neurons
Negative control
Any non-neural tissue (e.g. liver) or standard cell lines such as HEK293T or HeLa
α-Synuclein is highly expressed in the nervous system and is believed to consist of up to 1% of total cytosolic protein in the brain. α-Synuclein is expressed within neurons where it localises to pre-synaptic terminals with much lower levels of cell body expression. Outside of the nervous system, α-Synuclein is also expressed at signifncant levels in erythrocytes and platelets.
Subcellular expression
α-Synuclein is a soluble cytosolic protein that predominantly localises to pre-synaptic terminals. Adittionally, more recent evidence has suggested that α-Synuclein also localises to mitochondrial membranes.
Target function
α-Synuclein has important roles in normal physiology where is in involved in the regulation of synaptic vesicles. As part of this it has been suggested that α-Synuclein regulates vesicle recycling alongside regulating dopamine release. Adittionally α-Synuclein is been implicated in modulation of DNA repair, especially double strand breaks.
α-Synuclein is however more well known for its contribution to neurodegenerative diseases through its ability to misfold and then aggregate to cause insoluble plaques.
Processing
α-Synuclein is not subject to processing before reaching an active conformation
Post translational modifications
α-Synuclein is subject to phosphorlyation upon multiple residues including on tyrosines 39 and 125 alongside serines 42, 87 and 129.
Homology (compared to human)
In a BLAST search using the full protein sequence the following homologues were identified in the following species:
Rat - 95.0% homology
Mouse - 95.0% homology
Macaque - 98.6% homology
Similar proteins
In a BLAST search using the full protein sequence the only proteins with significant homology to α-Synuclein were:
β-synuclein - 58.0% homology
γ-synuclein - 62.7% homology
Epitope homology (between species)
In a BLAST search using the epitope sequence the α-Synuclein homologues from the following species showed the following homologies:
Orangutan, Patas monkey: 100%
Macaque, Tamarin, Rat, Mouse: 97.14%
Cow / Pig: 97.06%
Spider Monkey: 94.3%
Canary: 91.4%
Epitope homology (other proteins)
In a BLAST search using the epitope sequence only α-Synuclein was identified as having significant homology.
Storage & Handling
Storage instructions
-20°C
Shipping Conditions
On ice
Important
This product is for RESEARCH USE ONLY and is not intended for therapeutic or diagnostic use. Not for human or veterinary use
What guarantee do you have that my alpha-synuclein antibody will perform as expected?
We guarantee that your alpha-synuclein antibody will work for the applications and species we list on the datasheet. If the antibody fails to perform as expected then we are happy to offer a 100% refund guarantee. For more details please see our guarantee policy.
Will my alpha-synuclein antibody work against species that have not been listed on the datasheet?
A species not being listed doesn’t mean that the antibody won’t work, just that we haven’t tested it. If you test one of our antibodies in a new species please let us know (positive or negative)!
What protocols are available for use with this alpha-synuclein antibody
We have made a comprehensive collection of protocols that we have used in our experiments to validate this Hsp60 antibody
What mounting media do you recommend to use with this antibody?
We recommend using one of our high performance mounting medias, supplied as either hardset or aqeous with a range of counterstains:
Recombinant antibody to Neurofilament L - neurofilament component expressed in neurones. Part of the ValidAb™ range of highly validated, data-rich antibodies.


 Western Blot Protocol (1 MB)