Antibody to tyrosine hydroxylase (TH) - the rate limiting enzyme in catecholamine synthesis and used as a marker for catecholaminergic (dopaminergic and noradrenergic) neurones in the CNS. Part of the ValidAb™ range of highly validated, data-rich antibodies.
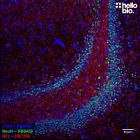
Figure 1. Tyrosine hydroxylase staining in mouse striatum and nucleus accumbens using HB6605.
HB6605 staining specifically labelled the dopaminergic neurones present in mouse striatum and nucleus accumbens. Image shown is from bregma ≈ 1.145mm. Abbreviations: CTX cortex, cc corpus callosum, SN septal nucleus, VL lateral ventricle, CP caudate putamen, aco anterior commissure, Nacc nucleus accumbens, OT olfactory tubercle. Method: Mice were perfused with PBS then 4% PFA before brains were removed and 40µm coronal sections prepared using a freezing microtome. Sections were incubated in 1% NaBH4 for 30 minutes then 0.05M glycine for 30 minutes. Section were blocked in 3% goat serum, 2% BSA for 2hrs before incubation overnight in HB6605 (1:1000 dilution, 150ng/ml) at 4°C. Sections were incubated with secondary antibody (Polyclonal goat anti-rabbit DyLight 488 conjugated, Thermofisher 35552, 1:150 dilution). For more detail please see our IHC(IF) protocol . Images were captured using a Leica DMI6000B inverted epifluorescence microscope (20x objective) coupled to a Leica DFC365FX monochrome digital camera with a GFP (89.1ms exposure and 3.2x gain) filter. Acquisition was carried out as both a z-stack (3.44µm stack spacing) and a tile scan which was merged using the mosaic merge function in LASX. The image was further processed in ImageJ (Schindelin et al., 2012. Nat Methods, 9(7), 676–682) using a Z-projection (maximum intensity) and using the subtract background (50px rolling ball radius) tool.
Figure 2. NeuN and Tyrosine hydroxylase expression in rat striatum.
HB6429 labels the nuclei of cell bodies in the striatum whereas HB6605 labels dopaminergic projections. Method: Rat brains were dissected and fixed overnight in 4% PFA before then being incubated in 30% sucrose (in PBS) until sunk (approx. 48hrs). A freezing microtome was used to cut 40µm transverse slices before sections were incubated in 1% NaBH4 for 30 minutes. Sections were blocked in 0.05M glycine, 2% BSA and 3% goat serum before incubation overnight in HB6429 (1:1000 dilution, 1µg/ml) and HB6605 (1:1,000 dilution). This was followed by a two hour incubation with polyclonal donkey anti-mouse DyLight 488 conjugated (Thermofisher SA5-10166, 1:300 dilution) and polyclonal goat anti-rabbit Janelia Fluor 525 conjugated secondary antibodies. DAPI (HB0747) was used at 1µg/ml to visualise cell nuclei. For more detail please see our IHC(IF) protocol. The image was captured as using a Leica DMI6000B inverted epifluorescence microscope coupled to a Photometric Prime 95B camera utilising a 10x objective and DAPI (8ms exposure) / L5 (200ms exposure) / RHO (250ms exposure) filters. Images were captured as a stack (4.3µm z-spacing) before being deconvolved using Huygens Professional software then flattened using a maximum Z projection in ImageJ (Schindelin et al., 2012. Nat Methods, 9(7), 676–682).
Figure 3. Myelin Basic Protein and Tyrosine hydroxylase expression in rat striatum.
HB6605 labels the dense network of dopaminergic fibres in the caudate putamen whereas HB8014 labels myelin containing axons. Method: Rat brains were dissected and fixed overnight in 4% PFA before then being incubated in 30% sucrose (in PBS) until sunk (approx. 48hrs). A freezing microtome was used to cut 40µm horizontal slices before sections were incubated in 1% NaBH4 for 15 minutes. Sections were blocked in 0.05M glycine, 2% BSA and 3% goat serum before incubation overnight in HB6605 (1:2000) and HB8014 (1:2,000 dilution). This was followed by a two hour incubation with secondary antibodies at a 1:300 dilution (polyclonal goat anti-mouse DyLight 488, Thermofisher, 35503 and goat anti-rabbit DyLight 650, Thermofisher 11804574). Propidium Iodide was included in the mounting media to visualise cell nuclei. For more detail please see our IHC(IF) protocol. Images were captured using Leica DMI6000B inverted epifluorescence microscope attached to a DFC365FX monochrome digital camera. The image was captured as a tilescan and z-stack (2.4µm spacing) using a 20x objective, GFP (583.7ms @ 5.5x gain), Y3 (210ms @ 4.4x gain) and Y5 (742ms @ 5.2x gain). The image was merged in LASX then deconvolved in Huygens professional before being flattened using a maximum Z projection in ImageJ (Schindelin et al., 2012. Nat Methods, 9(7), 676–682).
Figure 4. Independent antibody validation of HB6589 and HB6605 in rat CPu.
The staining pattens of HB6605 and HB6589 overlap in rat caudate putamen (CPu) showing strong evidence for antibody specificity. Method: Rat brains were dissected and fixed overnight in 4% PFA before then being incubated in 30% sucrose (in PBS) until sunk (approx. 48hrs). A freezing microtome was used to cut 40µm horizontal slices before sections were incubated in 1% NaBH4 for 15 minutes. Sections were blocked in 0.05M glycine, 2% BSA and 3% goat serum before incubation overnight in HB6589 (1:5,000 dilution), HB8014 (1:1,000 dilution) and HB6605 (1:4,000 dilution). This was followed by a two-hour incubation with secondary antibodies at a 1:300 dilution (polyclonal donkey anti-chicken DyLight 488, Thermofisher, A78948, polyclonal goat anti-mouse DyLight 550, Thermofisher, 84540 and polyclonal goat anti-rabbit DyLight 650, Thermofisher, 11804574). Sections were mounted using MightyMount Antifade Fluorescence Mounting Medium with DAPI (aqueous). For more detail please see our IHC(IF) protocol. Images were captured using a Leica DMI6000B inverted epifluorescence microscope. The image was captured using a 10x objective in a z-stack (5µm spacing). The image was captured as a tilescan using DAP (38ms exposure), L5 (264ms exposure), TX2 (61.8ms exposure) and Y5 (500ms exposure) filters. The stack was deconvolved using Huygens professional then flattened using a maximum Z projection in ImageJ (Schindelin et al., 2012. Nat Methods, 9(7), 676–682).
Figure 5. Tyrosine hydroxylase staining in rat striatum using HB6605.
The striatum is a key projection site for dopaminergic neurones. HB6605 stains the dense network of dopaminergic terminals found within the striatum in rat brain sections. Method: Brains were dissected from adult rats and fixed for 48hrs in 4% PFA before then incubated in 30% sucrose (in PBS) until the brains had sunk. A freezing microtome was used to cut 40µm coronal slices before sections were incubated in 1% NaBH4 for 30 minutes then 0.05M glycine for 30 minutes. Sections were blocked in 2% BSA, 3% goat serum before incubation overnight in HB6605 (1:1000, 150ng/ml) at 4°C. This was followed by a two hour incubation with secondary antibody (Polyclonal goat anti-rabbit DyLight 488 conjugated, Thermofisher 35552, 1:300 dilution). DAPI (HB0747) was used at 1µg/ml to visualise cell nuclei. For more detail please see our IHC(IF) protocol . Images were captured using a Leica SPE confocal laser scanning microscope coupled to a Leica DMi8 inverted epifluorescence microscope. The image was captured using a 40x objective (1.5x zoom), 405nm (24.5% power, PMT: 509V) and 488nm (30.1% power, PMT: 629V) laser lines in a z-stack (0.43µm spacing). Deconvolution was carried out using Huygens Essential (Scientific Volume Imagine) followed by the stack being flattened using a maximum Z projection in ImageJ (Schindelin et al., 2012. Nat Methods, 9(7), 676–682).
Figure 6. Tyrosine hydroxylase expression in various tissue lysates and preparations.
HB6433 revealed primary bands at 59kDa and 63kDa corresponding to unphosphorylated and phosphorylated forms of the protein. There was also a 50kDa band present in rat liver which could not be identified and a 33kDa band in the rat brain P2 membrane fraction which is believed to be a degradation product. Method: mouse brain and rat brain membrane (P2) and cytosol fractions were prepared following previous work (Molnar et al., 1993. Neuroscience 53:307-326) from freshly collected adult brains. Other tissue lysates were prepared following established protocols from freshly dissected tissue (see our guide on WB sample preparation). Samples were loaded (20µg / lane) onto a 12% acrylamide gel alongside a protein ladder (BioRad Precision Plus dual colour, 1610374) before being run at 60V for 40 minutes followed by 130V for 100 minutes. Wet transfer to a PVDF membrane was completed in 90 minutes using 400mA. The membrane was blocked for 2hrs in 5% non-fat dry milk before being incubated overnight at 4°C in HB6605 at a 1:1000 dilution (150ng/ml). Following washing the membrane was incubated in secondary antibody (1:10,000 dilution, Polyclonal goat anti-rabbit HRP conjugated, Sigma Aldrich A6154) for 2hrs. For more detail please see our Western blotting protocol. Detection was accomplished using Clarity Western ECL substrate (BioRad, 1705061) and a Licor Odyssey Fc imaging system (ECL channel: 10 min exposure, 700nm channel: 30 sec exposure). Following imaging the membrane was stripped by incubation with two changes of stripping buffer (HB7756) then was re-probed following the protocol described with HB9177 (mouse monoclonal anti-GAPDH) at a 1:4000 dilution (250ng/ml) overnight at 4°C. Following washing the membrane was incubated in secondary antibody (1:10,000 dilution, Polyclonal goat anti-mouse HRP conjugated, Sigma Aldrich A3682) for 2hrs and visualised again using Clarity Western ECL substrate (BioRad, 1705061) and a Licor Odyssey Fc imaging system (ECL channel: 4 min exposure, 700nm channel: 30 sec exposure).
Figure 7. Concentration response of HB6605 staining in rat striatal tissue.
HB6605 generated specific staining of dopaminergic terminals in the striatum at dilutions down to 1:2000 (75ng/ml). Method: Brains were dissected from adult rats and fixed for 48hrs in 4% PFA before then incubated in 30% sucrose (in PBS) until the brains had sunk. A freezing microtome was used to cut 40µm coronal slices before sections were incubated in 1% NaBH4 for 30 minutes then 0.05M glycine for 30 minutes. Sections were blocked in 2% BSA, 3% goat serum before incubation overnight in HB6605 ranging in concentration from 150ng/ml to 9.4ng/ml (1:1000 to 1:16,000 dilutions) at 4°C. This was followed by a two hour incubation with secondary antibody (Polyclonal goat anti-rabbit DyLight 488 conjugated, Thermofisher 35552, 1:300 dilution). DAPI (HB0747) was used at 1µg/ml to visualise cell nuclei. For more detail please see our IHC(IF) protocol . Images were captured using a Leica DMi8 inverted epifluorescence microscope (40x objective) coupled to a Leica DFC365FX monochrome digital camera with DAPI LP and FITC LP filters. Exposure times were as follows:
Images were captured as a z-stack and were processed in ImageJ (Schindelin et al., 2012. Nat Methods, 9(7), 676–682) using a maximal Z-projection then the subtract background (50px rolling ball radius) tool followed by stacking and montage creation.
Figure 8. Concentration response of HB6605 staining in a rat brain cytosol preparation.
HB6605 works down to a 1:2000 (75ng/ml) dilution in Western blot experiments. Method: cytosol fractions were prepared from fresh rat brains following established protocols (Molnar et al., 1993. Neuroscience 53:307-326). Rat cytosol samples were loaded (20µg / lane) onto a 10% acrylamide gel alongside a protein ladder (BioRad Precision Plus dual colour, 1610374) before being run at 65V for 30 minutes followed by 180V for 60 minutes. Wet transfer to a PVDF membrane was completed in 90 minutes using 400mA. Following transfer the membrane was cut into strips using Ponceau dye to visualise and cut individual lanes. Strips were blocked for 2hrs in 5% non-fat dry milk before being incubated overnight at 4°C in HB6605. Each strip was incubated separately with a separate HB6605 concentration with this ranging from 300ng/ml (1:500 dilution) to 1.2ng/ml (1:128,000 dilution). Following washing the membrane was incubated in secondary antibody (1:10,000 dilution, Polyclonal goat anti-rabbit HRP conjugated, Sigma Aldrich A6154) for 2hrs. For more detail please see our Western blotting protocol. Detection was accomplished using Clarity Western ECL substrate (BioRad, 1705061) and a Licor Odyssey Fc imaging system (ECL channel: 10 min exposure, 700nm channel: 30 sec exposure). Band intensity was calculated using Image Studio version 5.2.5 (LiCor) and a graph was constructed in GraphPad Prism 9 using a 3-parameter Hill equation curve fit.
Figure 9. Tyrosine hydroxylase staining in rat striatum using HB6605.
The striatum is a key projection site for dopaminergic neurones. HB6605 stains the dense network of dopaminergic terminals found within the striatum in rat brain sections. Method: Brains were dissected from adult rats and fixed for 48hrs in 4% PFA before then incubated in 30% sucrose (in PBS) until the brains had sunk. A freezing microtome was used to cut 40µm coronal slices before sections were incubated in 1% NaBH4 for 30 minutes then 0.05M glycine for 30 minutes. Sections were blocked in 2% BSA, 3% goat serum before incubation overnight in HB6605 (1:2000, 75ng/ml) at 4°C. This was followed by a two hour incubation with secondary antibody (Polyclonal goat anti-rabbit DyLight 488 conjugated, Thermofisher 35552, 1:300 dilution). DAPI (HB0747) was used at 1µg/ml to visualise cell nuclei. For more detail please see our IHC(IF) protocol protocol. Images were captured using a Leica SPE confocal laser scanning microscope coupled to a Leica DMi8 inverted epifluorescence microscope. The image was captured using a 40x objective (1.5x zoom), 405nm (24.5% power, PMT: 509V) and 488nm (30.1% power, PMT: 629V) laser lines in a z-stack (0.43µm spacing). Deconvolution was carried out using Huygens Essential (Scientific Volume Imagine) followed by the stack being flattened using a maximum Z projection in ImageJ (Schindelin et al., 2012. Nat Methods, 9(7), 676–682).
Product information
Immunogen
Denatured tyrosine hydroxylase purified from a rat phaeochromocytoma (adrenal medulla tumour)
Isotype
IgG
Purification
Immunogen affinity chromatography
Concentration
0.15 mg/ml
Formulation
10 mM HEPES (pH 7.5), 150 mM NaCl, 100µg/ml BSA, 0.05% sodium azide and 50% glycerol.
Predicted species reactivity
Mouse, Rat
Tested species reactivity
Mouse, Rat
Tested applications
Applications
WB, IHC(IF)
Western blot optimal concentration
1:1000 (150ng/ml) as tested in a rat brain cytosol preparation
IHC(IF) optimal concentration
1:2000 (75ng/ml) as tested in rat striatal brain sections
Positive control
Tissue known to have a high expression of catecholaminergic neurones (e.g. striatum or substantia nigra). PC-3 and SK-BR-3 cell lines also show tyrosine hydroxylase expression.
Negative control
Areas of the brain with low expression of catecholaminergic neurones (e.g. cortex). Most cells lines do not express TH (e.g. HEK293, HeLa, SH-SY5Y).
Tyrosine hydroxylase has 6 isoforms produced by alternative splicing:
Isoform 3 / TH type 4 (canonical) - 528aa, 58.6kDa.
Isoform 1 / TH type 3 - 524aa, 58.1kda,
Isoform 2 / TH type 1/HTH-1 - 497aa, 55,6kDa,
Isoform 4 / TH type 2/hTH-Delta2 - 501aa, 56.0kda,
Isoform 5 / hTH-Delta,2,8,9 - 407aa, 45.3kDa,
Isoform 6 / hTH-Delta1b,2,8,9 - 403aa 44.9kDa
Expression
Mainly expressed in the dopaminergic, noradrenergic and other catecholingergic neurones in the brain and adrenal glands. There is also lower peripheral expression in a variety of tissues.
Subcellular expression
Expression is enriched in axon terminals alongside cytosolic and perinuclear expression.
Target function
Tyrosine hydroxylase is the main rate limiting enzyme in producing catecholamines. The enzyme catalyses the conversion of L-tyrosine to L-DOPA which can then be converted by other enzymes into dopamine and noradrenaline.
Processing
None
Post translational modifications
Subject to phosphorlyation on Ser19, Ser62, Ser71 and Ser502.
Homology (compared to human)
Mouse and rat show 82.8% and 83.7% identity to human tyrosine hydroxylase respectively in a BLAST search.
Similar proteins
The following proteins were identified as being similar in a BLAST search:
Phenylalanine-4-hydroxylase – 52.8% identity
Tryptophan-5-hydroxylase 1 – 50.1% identity
Tryptophan-5-hydroxylase 2 – 52.1% identity
Storage & Handling
Storage instructions
-20°C
Shipping Conditions
On ice
Important
This product is for RESEARCH USE ONLY and is not intended for therapeutic or diagnostic use. Not for human or veterinary use
What counterstains do you recommend for use in ICC and IHC with this tyrosine hydroxylase antibody?
We recommend using either DAPI or Hoechst 33342 to label cell nuclei. In some experiments it is also helpful to label actin filaments in the cytoskeleton using a Phalloidin conjugate such as FITC Phalloidin or Rhodamine Phalloidin-TRITC.
What guarantee do you have that my tyrosine hydroxylase antibody will perform as expected?
We guarantee that your tyrosine hydroxylase antibody will work for the applications and species we list on the datasheet. If the antibody fails to perform as expected then we are happy to offer a 100% refund guarantee. For more details please see our guarantee policy.
What protocols are available for use with this tyrosine hydroxylase antibody
We have made a comprehensive collection of protocols that we have used in our experiments to validate this tyrosine hydroxylase antibody.
Will my tyrosine hydroxylase antibody work against species that have not been listed on the datasheet?
A species not being listed doesn’t mean that the tyrosine hydroxylase antibody won’t work, just that we haven’t tested it. If you test one of our antibodies in a new species please let us know (positive or negative)!
What does tyrosine hydroxylase do?
Tyrosine hydroxylase (TH) is a key enzyme in the catecholamine biosynthesis pathway. It catalyzes the first and rate-limiting step in the synthesis of catecholamine neurotransmitters, such as dopamine, norepinephrine (noradrenaline), and epinephrine (adrenaline). These neurotransmitters play essential roles in a wide array of physiological processes, including motor control and mood regulation.
What is tyrosine hydroxylase a marker for?
Tyrosine hydroxylase (TH) is a specific marker for catecholaminergic neurons , which include neurons that produce dopamine, norepinephrine (noradrenaline), and epinephrine (adrenaline). TH principally stains:
Dopamine neurons of the substantia nigra, ventral tegmental area and hypothalamus,
Noradrenergic neurons of the locus coeruleus,
Adrenergic neurons of the medulla oblongata.
What mounting media do you recommend to use with this antibody?
We recommend using one of our high performance mounting medias, supplied as either hardset or aqeous with a range of counterstains:
What counterstains do you recommend for use in ICC and IHC with this antibody?
We recommend using either DAPI or Hoechst 33342 to label cell nuclei. In some experiments it is also helpful to label actin filaments in the cytoskeleton using a Phalloidin conjugate such as FITC Phalloidin or Rhodamine Phalloidin-TRITC.
Antibody to tyrosine hydroxylase (TH) - the rate limiting enzyme in catecholamine synthesis and used as a marker for catecholaminergic (dopaminergic and noradrenergic) neurones in the CNS. Part of the ValidAb™ range of highly validated, data-rich antibodies.
Antibody to tyrosine hydroxylase (TH) - the rate limiting enzyme in catecholamine synthesis and used as a marker for catecholaminergic (dopaminergic and noradrenergic) neurones in the CNS. Part of the ValidAb™ range of highly validated, data-rich antibodies.


 Western Blot Protocol (1 MB)