Antibody to myelin basic protein (MBP) - marker for oligodendrocytes and Schwann cells. Part of the ValidAb™ range of highly validated, data-rich antibodies.
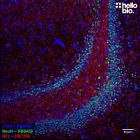
Figure 1. Myelin basic protein (MBP) and neurofilament L (NFL) staining in rat cerebellum visualised using HB8014.
HB8014 visualised the dense network of neuronal projections in the cerebellum. Method: Brains were dissected from adult rats and fixed for 48hrs in 4% PFA before then incubated in 30% sucrose (in PBS) until the brains had sunk. A freezing microtome was used to cut 40µm transverse slices before sections were incubated in 1% NaBH4 for 30 minutes then 0.05M glycine for 30 minutes. Sections were blocked in 2% BSA, 3% goat serum before incubation overnight in HB8014 (1:1000, 1µg/ml) and HB7266 (rabbit monoclonal anti-neurofilament L; 1:1000, 1µg/ml) at 4°C. This was followed by a two hour incubation with secondary antibodies (Polyclonal goat anti-mouse DyLight 488 conjugated, Thermofisher 35503, 1:300 dilution and polyclonal goat anti-rabbit DyLight 594 conjugated, Thermofisher 35561, 1:300 dilution). DAPI (HB0747) was used at 1µg/ml to visualise cell nuclei. For more detail please see our IHC(IF) protocol . Images were captured using a Leica SPE confocal laser scanning microscope coupled to a Leica DMi8 inverted epifluorescence microscope. The image was captured using a 20x objective, 405nm (31.2% power, gain: 594), 488nm (31.2% power, gain: 749) and 532nm laser lines (32.3% power, gain: 758) in a z-stack (1.63µm spacing). Deconvolution was carried out using Huygens Essential (Scientific Volume Imagine) followed by the stack being flattened using a maximum Z projection in ImageJ (Schindelin et al., 2012. Nat Methods, 9(7), 676–682).
Figure 2. Myelin basic protein (MBP) and neurofilament L (NFL) staining in rat cerebellum visualised using HB8014.
HB8014 visualised the dense network of neuronal projections in the cerebellum. Method: Brains were dissected from adult rats and fixed for 48hrs in 4% PFA before then incubated in 30% sucrose (in PBS) until the brains had sunk. A freezing microtome was used to cut 40µm transverse slices before sections were incubated in 1% NaBH4 for 30 minutes then 0.05M glycine for 30 minutes. Sections were blocked in 2% BSA, 3% goat serum before incubation overnight in HB8014 (1:2000, 0.5µg/ml) and HB7266 (rabbit monoclonal anti-neurofilament L; 1:2000, 0.5µg/ml) at 4°C. This was followed by a two hour incubation with secondary antibodies (Polyclonal goat anti-mouse DyLight 488 conjugated, Thermofisher 35503, 1:300 dilution and polyclonal goat anti-rabbit DyLight 594 conjugated, Thermofisher 35561, 1:300 dilution). DAPI (HB0747) was used at 1µg/ml to visualise cell nuclei. For more detail please see our IHC(IF) protocol . Images were captured using a Leica SPE confocal laser scanning microscope coupled to a Leica DMi8 inverted epifluorescence microscope. The image was captured using a 40x objective, 405nm (31.2% power, gain: 578), 488nm (31.2% power, gain: 793) and 532nm laser lines (32.3% power, gain: 750) in a z-stack (0.33 µm spacing). Deconvolution was carried out using Huygens Essential (Scientific Volume Imagine) followed by the stack being flattened using a maximum Z projection in ImageJ (Schindelin et al., 2012. Nat Methods, 9(7), 676–682).
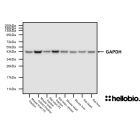
Figure 3. MBP expression in various tissue lysates and preparations.
HB8014 revealed the twin MBP transcripts of around 22.5kDa and 18.1kDa in rat brain P2 fraction only. HB8014 was unable to detect MBP in mouse tissue. Method: mouse brain and rat brain membrane (P2) and cytosol fractions were prepared following previous work (Molnar et al., 1993. Neuroscience 53:307-326) from freshly collected adult brains. Other tissue lysates were prepared following established protocols from freshly dissected tissue (see our guide on WB sample preparation). Samples were loaded (20µg / lane) onto a 15% acrylamide gel alongside a protein ladder (BioRad Precision Plus Dual Colour, 1610374) before being run at 60V for 30 minutes followed by 130V for 90 minutes. Wet transfer to a PVDF membrane was completed in 90 minutes using 400mA. The membrane was blocked for 2hrs in 5% non-fat dry milk before being incubated overnight at 4°C in HB8014 at a 1:5,000 dilution (200ng/ml). Following washing the membrane was incubated in secondary antibody (1:10,000 dilution, Polyclonal goat anti-mouse HRP conjugated, Sigma Aldrich A3682) for 2hrs. For more detail please see our Western blotting protocol. Detection was accomplished using Clarity Western ECL substrate (BioRad, 1705061) and a Licor Odyssey Fc imaging system (ECL channel: 10 min exposure, 700nm channel: 30 sec exposure). Following imaging the membrane was stripped with two changes of stripping buffer (HB7756) before being washed, blocked for 2 hours in 5% non-fat dry milk and incubated in HB9177 (1:4,000 dilution, 0.25µg/ml) overnight at 4°C. Following washing the membrane was incubated in secondary antibody (1:10,000 dilution, Polyclonal goat anti-mouse HRP conjugated, Sigma Aldrich A3682) for 2hrs and visualised again using Clarity Western ECL substrate (BioRad, 1705061) and a Licor Odyssey Fc imaging system (ECL channel: 4 min exposure, 700nm channel: 30 sec exposure).
Figure 4. Concentration response of HB8014 staining in a rat brain P2 fraction preparation.
HB8014 detected the MBP twin transcripts at dilutions down to 1:8,000 (125ng/ml). Method: P2 fractions were prepared from fresh rat brains following established protocols (Molnar et al., 1993. Neuroscience 53:307-326). Rat brain P2 fraction samples were loaded (20µg / lane) onto a 15% acrylamide gel alongside a protein ladder (BioRad Precision Plus Dual Colour, 1610374) before being run at 60V for 35 minutes followed by 130V for 90 minutes. Wet transfer to a PVDF membrane was completed in 90 minutes using 400mA. Following transfer the membrane was cut into strips using Ponceau dye to visualise and cut individual lanes. Strips were blocked for 2hrs in 5% non-fat dry milk before being incubated overnight at 4°C in HB8014. Each strip was incubated separately with a separate HB8014 concentration with this ranging from 1µg/ml (1:1,000 dilution) to 3.9ng/ml (1:256,000 dilution). Following washing the membrane was incubated in secondary antibody (1:10,000 dilution, Polyclonal goat anti-mouse HRP conjugated, Sigma Aldrich A3682) for 2hrs. For more detail please see our Western blotting protocol. Detection was accomplished using Clarity Western ECL substrate (BioRad, 1705061) and a Licor Odyssey Fc imaging system (ECL channel: 10 min exposure, 700nm channel: 30 sec exposure). Band intensity was calculated using Image Studio version 5.2.5 (LiCor) and a graph was constructed in GraphPad Prism 9 using a 3-parameter Hill equation curve fit.
Figure 5. The effect of varying HB8014 concentration upon MBP staining in rat cerebellum.
HB8014 worked well down to a concentration of 500ng/ml (1:2,000 dilution). Method: Brains were dissected from adult rats and fixed for 48hrs in 4% PFA before then incubated in 30% sucrose (in PBS) until the brains had sunk. A freezing microtome was used to cut 40µm transverse slices before sections were incubated in 1% NaBH4 for 30 minutes then 0.05M glycine for 30 minutes. Sections were blocked in 2% BSA, 3% goat serum for 2 hours before incubation overnight in HB8014 ranging in concentration from 0.125 to 1µg/ml (1:8,000 to 1:1000) at 4°C. This was followed by a two hour incubation with secondary antibody (polyclonal goat anti-mouse DyLight 488 conjugated, Thermofisher 35503, 1:300 dilution). DAPI (HB0747) was used at 1µg/ml to visualise cell nuclei. For more detail please see our IHC(IF) protocol. Images were captured using a Leica DMi8 inverted epifluorescence microscope (20x objective) in a z-stack (1.1µm spacing) coupled to a Leica DFC365FX monochrome digital camera with DAPI LP and FITC LP filters. Exposure times were as follows:
Images were processed in ImageJ (Schindelin et al., 2012. Nat Methods, 9(7), 676–682) using the subtract background (75px rolling ball radius) tool followed by Z-projection, stacking and montage creation.
Figure 6. Myelin basic protein (MBP) and neurofilament L (NFL) staining of a dense axonal network in rat cerebellum visualised using HB8014.
HB8014 visualised the dense network of neuronal projections in the cerebellum. Method: Brains were dissected from adult rats and fixed for 48hrs in 4% PFA before then incubated in 30% sucrose (in PBS) until the brains had sunk. A freezing microtome was used to cut 40µm transverse slices before sections were incubated in 1% NaBH4 for 30 minutes then 0.05M glycine for 30 minutes. Sections were blocked in 2% BSA, 3% goat serum before incubation overnight in HB8014 (1:1000, 1µg/ml) and HB7266 (rabbit monoclonal anti-neurofilament L; 1:1000, 1µg/ml) at 4°C. This was followed by a two hour incubation with secondary antibodies (Polyclonal goat anti-mouse DyLight 488 conjugated, Thermofisher 35503, 1:300 dilution and polyclonal goat anti-rabbit DyLight 594 conjugated, Thermofisher 35561, 1:300 dilution). DAPI (HB0747) was used at 1µg/ml to visualise cell nuclei. For more detail please see our IHC(IF) protocol . Images were captured using a Leica SPE confocal laser scanning microscope coupled to a Leica DMi8 inverted epifluorescence microscope. The image was captured using a 40x objective, 405nm (31.2% power, gain: 578), 488nm (31.2% power, gain: 793) and 532nm laser lines (32.3% power, gain: 750) in a z-stack (0.33 µm spacing). Deconvolution was carried out using Huygens Essential (Scientific Volume Imagine) followed by the stack being flattened using a maximum Z projection in ImageJ (Schindelin et al., 2012. Nat Methods, 9(7), 676–682).
Figure 1. Myelin basic protein (MBP) and neurofilament L (NFL) staining in rat cerebellum visualised using HB8014.
HB8014 visualised the dense network of neuronal projections in the cerebellum. Method: Brains were dissected from adult rats and fixed for 48hrs in 4% PFA before then incubated in 30% sucrose (in PBS) until the brains had sunk. A freezing microtome was used to cut 40µm transverse slices before sections were incubated in 1% NaBH4 for 30 minutes then 0.05M glycine for 30 minutes. Sections were blocked in 2% BSA, 3% goat serum before incubation overnight in HB8014 (1:1000, 1µg/ml) and HB7266 (rabbit monoclonal anti-neurofilament L; 1:1000, 1µg/ml) at 4°C. This was followed by a two hour incubation with secondary antibodies (Polyclonal goat anti-mouse DyLight 488 conjugated, Thermofisher 35503, 1:300 dilution and polyclonal goat anti-rabbit DyLight 594 conjugated, Thermofisher 35561, 1:300 dilution). DAPI (HB0747) was used at 1µg/ml to visualise cell nuclei. For more detail please see our IHC(IF) protocol . Images were captured using a Leica SPE confocal laser scanning microscope coupled to a Leica DMi8 inverted epifluorescence microscope. The image was captured using a 20x objective, 405nm (31.2% power, gain: 594), 488nm (31.2% power, gain: 749) and 532nm laser lines (32.3% power, gain: 758) in a z-stack (1.63µm spacing). Deconvolution was carried out using Huygens Essential (Scientific Volume Imagine) followed by the stack being flattened using a maximum Z projection in ImageJ (Schindelin et al., 2012. Nat Methods, 9(7), 676–682).
Figure 2. Myelin basic protein (MBP) and neurofilament L (NFL) staining in rat cerebellum visualised using HB8014.
HB8014 visualised the dense network of neuronal projections in the cerebellum. Method: Brains were dissected from adult rats and fixed for 48hrs in 4% PFA before then incubated in 30% sucrose (in PBS) until the brains had sunk. A freezing microtome was used to cut 40µm transverse slices before sections were incubated in 1% NaBH4 for 30 minutes then 0.05M glycine for 30 minutes. Sections were blocked in 2% BSA, 3% goat serum before incubation overnight in HB8014 (1:2000, 0.5µg/ml) and HB7266 (rabbit monoclonal anti-neurofilament L; 1:2000, 0.5µg/ml) at 4°C. This was followed by a two hour incubation with secondary antibodies (Polyclonal goat anti-mouse DyLight 488 conjugated, Thermofisher 35503, 1:300 dilution and polyclonal goat anti-rabbit DyLight 594 conjugated, Thermofisher 35561, 1:300 dilution). DAPI (HB0747) was used at 1µg/ml to visualise cell nuclei. For more detail please see our IHC(IF) protocol . Images were captured using a Leica SPE confocal laser scanning microscope coupled to a Leica DMi8 inverted epifluorescence microscope. The image was captured using a 40x objective, 405nm (31.2% power, gain: 578), 488nm (31.2% power, gain: 793) and 532nm laser lines (32.3% power, gain: 750) in a z-stack (0.33 µm spacing). Deconvolution was carried out using Huygens Essential (Scientific Volume Imagine) followed by the stack being flattened using a maximum Z projection in ImageJ (Schindelin et al., 2012. Nat Methods, 9(7), 676–682).
Figure 3. MBP expression in various tissue lysates and preparations.
HB8014 revealed the twin MBP transcripts of around 22.5kDa and 18.1kDa in rat brain P2 fraction only. HB8014 was unable to detect MBP in mouse tissue. Method: mouse brain and rat brain membrane (P2) and cytosol fractions were prepared following previous work (Molnar et al., 1993. Neuroscience 53:307-326) from freshly collected adult brains. Other tissue lysates were prepared following established protocols from freshly dissected tissue (see our guide on WB sample preparation). Samples were loaded (20µg / lane) onto a 15% acrylamide gel alongside a protein ladder (BioRad Precision Plus Dual Colour, 1610374) before being run at 60V for 30 minutes followed by 130V for 90 minutes. Wet transfer to a PVDF membrane was completed in 90 minutes using 400mA. The membrane was blocked for 2hrs in 5% non-fat dry milk before being incubated overnight at 4°C in HB8014 at a 1:5,000 dilution (200ng/ml). Following washing the membrane was incubated in secondary antibody (1:10,000 dilution, Polyclonal goat anti-mouse HRP conjugated, Sigma Aldrich A3682) for 2hrs. For more detail please see our Western blotting protocol. Detection was accomplished using Clarity Western ECL substrate (BioRad, 1705061) and a Licor Odyssey Fc imaging system (ECL channel: 10 min exposure, 700nm channel: 30 sec exposure). Following imaging the membrane was stripped with two changes of stripping buffer (HB7756) before being washed, blocked for 2 hours in 5% non-fat dry milk and incubated in HB9177 (1:4,000 dilution, 0.25µg/ml) overnight at 4°C. Following washing the membrane was incubated in secondary antibody (1:10,000 dilution, Polyclonal goat anti-mouse HRP conjugated, Sigma Aldrich A3682) for 2hrs and visualised again using Clarity Western ECL substrate (BioRad, 1705061) and a Licor Odyssey Fc imaging system (ECL channel: 4 min exposure, 700nm channel: 30 sec exposure).
Figure 4. Concentration response of HB8014 staining in a rat brain P2 fraction preparation.
HB8014 detected the MBP twin transcripts at dilutions down to 1:8,000 (125ng/ml). Method: P2 fractions were prepared from fresh rat brains following established protocols (Molnar et al., 1993. Neuroscience 53:307-326). Rat brain P2 fraction samples were loaded (20µg / lane) onto a 15% acrylamide gel alongside a protein ladder (BioRad Precision Plus Dual Colour, 1610374) before being run at 60V for 35 minutes followed by 130V for 90 minutes. Wet transfer to a PVDF membrane was completed in 90 minutes using 400mA. Following transfer the membrane was cut into strips using Ponceau dye to visualise and cut individual lanes. Strips were blocked for 2hrs in 5% non-fat dry milk before being incubated overnight at 4°C in HB8014. Each strip was incubated separately with a separate HB8014 concentration with this ranging from 1µg/ml (1:1,000 dilution) to 3.9ng/ml (1:256,000 dilution). Following washing the membrane was incubated in secondary antibody (1:10,000 dilution, Polyclonal goat anti-mouse HRP conjugated, Sigma Aldrich A3682) for 2hrs. For more detail please see our Western blotting protocol. Detection was accomplished using Clarity Western ECL substrate (BioRad, 1705061) and a Licor Odyssey Fc imaging system (ECL channel: 10 min exposure, 700nm channel: 30 sec exposure). Band intensity was calculated using Image Studio version 5.2.5 (LiCor) and a graph was constructed in GraphPad Prism 9 using a 3-parameter Hill equation curve fit.
Figure 5. The effect of varying HB8014 concentration upon MBP staining in rat cerebellum.
HB8014 worked well down to a concentration of 500ng/ml (1:2,000 dilution). Method: Brains were dissected from adult rats and fixed for 48hrs in 4% PFA before then incubated in 30% sucrose (in PBS) until the brains had sunk. A freezing microtome was used to cut 40µm transverse slices before sections were incubated in 1% NaBH4 for 30 minutes then 0.05M glycine for 30 minutes. Sections were blocked in 2% BSA, 3% goat serum for 2 hours before incubation overnight in HB8014 ranging in concentration from 0.125 to 1µg/ml (1:8,000 to 1:1000) at 4°C. This was followed by a two hour incubation with secondary antibody (polyclonal goat anti-mouse DyLight 488 conjugated, Thermofisher 35503, 1:300 dilution). DAPI (HB0747) was used at 1µg/ml to visualise cell nuclei. For more detail please see our IHC(IF) protocol. Images were captured using a Leica DMi8 inverted epifluorescence microscope (20x objective) in a z-stack (1.1µm spacing) coupled to a Leica DFC365FX monochrome digital camera with DAPI LP and FITC LP filters. Exposure times were as follows:
Images were processed in ImageJ (Schindelin et al., 2012. Nat Methods, 9(7), 676–682) using the subtract background (75px rolling ball radius) tool followed by Z-projection, stacking and montage creation.
Figure 6. Myelin basic protein (MBP) and neurofilament L (NFL) staining of a dense axonal network in rat cerebellum visualised using HB8014.
HB8014 visualised the dense network of neuronal projections in the cerebellum. Method: Brains were dissected from adult rats and fixed for 48hrs in 4% PFA before then incubated in 30% sucrose (in PBS) until the brains had sunk. A freezing microtome was used to cut 40µm transverse slices before sections were incubated in 1% NaBH4 for 30 minutes then 0.05M glycine for 30 minutes. Sections were blocked in 2% BSA, 3% goat serum before incubation overnight in HB8014 (1:1000, 1µg/ml) and HB7266 (rabbit monoclonal anti-neurofilament L; 1:1000, 1µg/ml) at 4°C. This was followed by a two hour incubation with secondary antibodies (Polyclonal goat anti-mouse DyLight 488 conjugated, Thermofisher 35503, 1:300 dilution and polyclonal goat anti-rabbit DyLight 594 conjugated, Thermofisher 35561, 1:300 dilution). DAPI (HB0747) was used at 1µg/ml to visualise cell nuclei. For more detail please see our IHC(IF) protocol . Images were captured using a Leica SPE confocal laser scanning microscope coupled to a Leica DMi8 inverted epifluorescence microscope. The image was captured using a 40x objective, 405nm (31.2% power, gain: 578), 488nm (31.2% power, gain: 793) and 532nm laser lines (32.3% power, gain: 750) in a z-stack (0.33 µm spacing). Deconvolution was carried out using Huygens Essential (Scientific Volume Imagine) followed by the stack being flattened using a maximum Z projection in ImageJ (Schindelin et al., 2012. Nat Methods, 9(7), 676–682).
Product information
Immunogen
Myelin basic protein (MBP) purified from bovine brain
Epitope
Amino acids 145 - 184 of the human 21.5kDa sequence corresponding to the amino acid sequence: AEGQRPGFGYGGRASDYKSAHKGFKGVDAQGTLSKIFKLG
Clone number
7D2
Isotype
IgG1
Purification
Protein G affinity purification
Concentration
1 mg/ml
Formulation
50% PBS, 50% glycerol + 5mM sodium azide
Predicted species reactivity
Rat, Human, Pig, Horse, Cow
Tested species reactivity
Rat, Mouse (no staining)
Tested applications
Applications
WB, IHC(IF)
Western blot optimal concentration
250ng/ml (1:4,000 dilution) as tested in a rat brain P2 membrane preparation
IHC(IF) optimal concentration
500ng/ml (1:2,000 dilution) as tested in rat cerebellum sections
Positive control
Myelin basic protein is present in large quantities within the CNS and PNS therefore brain and/or other nerve samples form an excellent positive control. MBP expression has been reported (see the human protein atlas) in some cell lines such as SK-MEL-30 cells.
Negative control
MBP is not found in appreciable quantities in peripheral tissues therefore these can be used as a negative control. Within the brain MBP is associated with the membrane bound fraction and is absent from the cytosol therefore this can be used as a negative control. MBP is also absent from many common cells lines such as SH-SY5Y, HeLa and HEK293 cells.
Myelin A1 protein, Myelin membrane encephalitogenic protein
UniProt ID
P02686
Structure image
Gene name
MBP
NCBI full gene name
myelin basic protein
Entrez gene ID
4155
Amino acids
160 - 304 (17.3 - 33.1kDa) depending upon isotype
Isoforms
Myelin basic protein has a number of isoforms expressed under the control of alternative splicing:
Isoform 1 (canonical), also known as Golli-MBP1, HOG7: 304aa, 33.1kDa
Isoform 2, also known as Golli-MBP2, HOG5: 197aa, 21.5kDa
Isoform 3, also known as MBP1, 197aa, 21.5kDa
Isoform 4, also known as MBP2, 186aa, 20.2kDa
Isoform 5, also known as MBP3, 171aa, 18.6kDa
Isoform 6, also known as MBP4, 160 aa, 17.3kDa
Expression
MBP isoforms are expressed widely in the CNS and PNS within the myelin sheaths that surround axons. Oligodendrocytes in the CNS and their equivalent in the PNS, Schwann cells, express MBP strongly therefore MBP is a good marker for them. The golli forms of MBP are also expressed in the immune system and bone marrow.
Subcellular expression
Expressed within the cytosol of oligodendrocytes and Schwann cells and the myelin sheath of axons. The 21.kDa isoform (MBP1) is also found in the nucleus of oligodendrocytes.
Target function
MBP is essential for the formation and maintenance of the myelin sheaths that surround and insulate the axons of neurones. Amongst many roles, MBP helps anchor the layers of the myelin sheath together to ensure they are as compact as possible, reducing the permeability to escaping ions from the neuron. This enables the long distance transmission of signals down axons with limited loss in signal strength.
Processing
The initiator methionine is removed from isoforms 3-6.
Post translational modifications
MBP isoforms are subject to numerous post-translational modifications including phosphorylation, citrullination and acetylation. Some of these modification fall within the epitope of HB8014.
Homology (compared to human)
Mouse and rat isoforms have a 74.6% and 92.9% identity to human MBP in a BLAST search
Similar proteins
No similar proteins reported in a BLAST search
Epitope homology (between species)
In a BLAST search only MBP resulted as a match with the epitope sequence.
Epitope homology (other proteins)
In a BLAST search the following species' MBP proteins had the following homology with the epitope sequence:
Human – 100% identity
Bovine – 92.5% identity
Chimpanzee – 95.1% identity
Rat – 92.7% identity
Mouse – 92.7% mouse
Rabbit – 85% identity
Horse – 85.4% identity
Pig – 85.4% identity
Chicken – 61.0% identity
Storage & Handling
Storage instructions
-20°C
Shipping Conditions
On ice
Important
This product is for RESEARCH USE ONLY and is not intended for therapeutic or diagnostic use. Not for human or veterinary use
We tested this antibody using mouse tissue in multiple Western blots and were unable to detect MBP. We have not used this antibody in mouse tissue for IHC(IF) but cannot offer any assurance as to it working in mice.
What protocols are available for use with this MBP antibody?
We have made a comprehensive collection of protocols that we have used in our experiments to validate this myelin basic protein antibody.
Will my MBP antibody work against species that have not been listed on the datasheet?
A species not being listed doesn’t mean that the MBP antibody won’t work, just that we haven’t tested it. If you test one of our antibodies in a new species please let us know (positive or negative)!
Note: For this MBP antibody we have been unable to generate MBP staining in mouse tissue therefore do not recommend using it in mice
What counterstains do you recommend for use in ICC and IHC with this MBP antibody?
We recommend using either DAPI or Hoechst 33342 to label cell nuclei. In some experiments it is also helpful to label actin filaments in the cytoskeleton using a Phalloidin conjugate such as FITC Phalloidin or Rhodamine Phalloidin-TRITC.
What mounting media do you recommend to use with this antibody?
We recommend using one of our high performance mounting medias, supplied as either hardset or aqeous with a range of counterstains:
Immunosignals of Oligodendrocyte Markers and Myelin-Associated Proteins Are Critically Affected after Experimental Stroke in Wild-Type and Alzheimer Modeling Mice of Different Ages.
Michalski D et al (2018) Frontiers in cellular neuroscience 12 : 23
Antibody to myelin basic protein (MBP) - marker for oligodendrocytes and Schwann cells. Part of the ValidAb™ range of highly validated, data-rich antibodies.
Recombinant antibody to Neurofilament L - neurofilament component expressed in neurones. Part of the ValidAb™ range of highly validated, data-rich antibodies.


 and neurofilament L (NFL) staining in rat cerebellum visualised using HB8014.")
 and neurofilament L (NFL) staining in rat cerebellum visualised using HB8014.")


 and neurofilament L (NFL) staining of a dense axonal network in rat cerebellum visualised using HB8014.")

 Western Blot Protocol (1 MB)