Antibody to GAT1 - GABA reuptake transporter and marker for GABAergic interneurones. Part of the ValidAb™ range of highly validated, data-rich antibodies.
Figure 1. GAT1 staining in GABAergic interneurons of the cerebellum using HB7632.
HB7632 staining reveals the layer of GAT1 containing inhibitory interneurons in the cerebellum. Method: Brains were dissected from adult rats and fixed for 48hrs in 4% PFA before then incubated in 30% sucrose (in PBS) until the brains had sunk. A freezing microtome was used to cut 40µm transverse slices before sections were incubated in 1% NaBH4 for 30 minutes then 0.05M glycine for 30 minutes. Sections were blocked in 2% BSA, 3% goat serum before incubation overnight in HB7632 (1:250, 1µg/ml) at 4°C. This was followed by a two hour incubation with secondary antibody (Polyclonal goat anti-rabbit DyLight 488 conjugated, Thermofisher 35552, 1:300 dilution). DAPI (HB0747) was used at 1µg/ml to visualise cell nuclei. For more detail please see our IHC(IF) protocol . Images were captured using a Leica SPE confocal laser scanning microscope coupled to a Leica DMi8 inverted epifluorescence microscope. The image was captured using a 20x objective, 405nm (24.5% power, gain: 563V) and 488nm (30.1% power, gain: 742V) laser lines in a z-stack (1.63µm spacing). Deconvolution was carried out using Huygens Essential (Scientific Volume Imagine) followed by the stack being flattened using a maximum Z projection in ImageJ (Schindelin et al., 2012. Nat Methods, 9(7), 676–682).
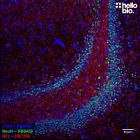
Figure 2. Parvalbumin and GAT1 expressing neurons in rat cerebellum.
Rat cerebellum stained by HB6457 for Parvalbumin (mouse monoclonal) and HB7632 for GAT1 (rabbit polyclonal). Method: Rat brains were dissected and fixed overnight in 4% PFA before then being incubated in 30% sucrose (in PBS) until sunk (approx. 48hrs). A freezing microtome was used to cut 40µm horizontal slices before sections were incubated in 1% NaBH4 for 30 minutes. Sections were blocked in 0.05M glycine, 2% BSA and 3% donkey serum before incubation overnight in HB6457 (1:500, 2µg/ml) and HB7632 (1:500 dilution). This was followed by a two hour incubation with secondary antibodies at a 1:300 dilution (polyclonal goat anti-mouse DyLight488, Thermofisher, 35503 and goat anti-rabbit DyLight 594, Thermofisher 35561). DAPI (HB0747) was used at 1µg/ml to visualise cell nuclei. For more detail please see our IHC(IF) protocol. Images were captured using a Leica DMI6000B inverted epifluorescence microscope. The image was captured as a tilescan using a 40x objective in a z-stack (1.5µm spacing). The image was captured using DAP (5.2ms exposure), L5 (73.5ms exposure) and TX2 (25.0ms exposure) filters. The stack was deconvolved using Huygens professional then flattened using a maximum Z projection in ImageJ (Schindelin et al., 2012. Nat Methods, 9(7), 676–682).
Figure 3. GAT1 staining in the GABAergic interneurons of hippocampal CA1 using HB7632.
HB7632 staining reveals the layer of GAT1 containing inhibitory interneurons in the cerebellum. Method: hippocampi were dissected from rat brains and fixed overnight in 4% PFA before then being incubated in 30% sucrose (in PBS) for another 24hrs. A freezing microtome was used to cut 40µm transverse slices before sections were incubated in 1% NaBH4 then 0.05M glycine for 30 minutes. Section were blocked in 1% BSA, 22.52mg/ml glycine before incubation overnight in HB7632 (1:250 dilution, 1µg/ml). This was followed by a two hour incubation with secondary antibody (Polyclonal goat anti-rabbit DyLight 594 conjugated, Thermofisher 35561, 1:500 dilution). DAPI (HB0747) was used at 1µg/ml to visualise cell nuclei. For more detail please see our IHC(IF) protocol . Images were captured using a Leica DMI6000B inverted epifluorescence microscope (20x objective) coupled to a Photometric-Prime95B monochrome digital camera with DAPI (5.6ms exposure) and TX2 (28.5ms exposure) filters. The image was processed in ImageJ (Schindelin et al., 2012. Nat Methods, 9(7), 676–682) using the subtract background (50px rolling ball radius) tool.
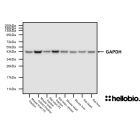
Figure 4. GAT1 expression in rat brain P2 membrane fraction but not other rat tissue lysates and preparations.
HB7632 revealed a band of approximately 65kDa corresponding to GAT1 only in the rat brain P2 fraction corresponding to GAT1’s membrane bound expression. Method: Rat brain membrane (P2) and cytosol fractions were prepared following previous work (Molnar et al., 1993. Neuroscience 53:307-326) from freshly collected adult brains. Other tissue lysates were prepared following established protocols from freshly dissected tissue (see our guide on WB sample preparation). Samples were loaded (20µg / lane) onto a 10% acrylamide gel alongside a protein ladder (NEB Colour prestained , P7719S) before being run at 60V for 25 minutes followed by 130V for 80 minutes. Wet transfer to a PVDF membrane was completed in 90 minutes using 400mA. The membrane was blocked for 2hrs in 5% non-fat dry milk before being incubated overnight at 4°C in HB7632 at a 1:1,000 dilution (250ng/ml). Following washing the membrane was incubated in secondary antibody (1:10,000 dilution, Polyclonal goat anti-rabbit HRP conjugated, Sigma Aldrich A6154) for 2hrs. For more detail please see our Western blotting protocol. Detection was accomplished using Clarity Western ECL substrate (BioRad, 1705061) and a Licor Odyssey Fc imaging system (ECL channel: 10 min exposure, 700nm channel: 30 sec exposure). Following imaging the membrane was stripped with two changes of stripping buffer (HB7756) before being washed, blocked for 2 hours in 5% non-fat dry milk and incubated in HB9177 (1:4,000 dilution, 0.25µg/ml) overnight at 4°C. Following washing, the membrane was incubated in secondary antibody (1:10,000 dilution, Polyclonal goat anti-mouse HRP conjugated, Sigma Aldrich A3682) for 2hrs and visualised again using Clarity Western ECL substrate (BioRad, 1705061) and a Licor Odyssey Fc imaging system (ECL channel: 4 min exposure, 700nm channel: 30 sec exposure).
Figure 5. GAT1 expression in mouse brain P2 membrane fraction but not other mouse tissue lysates and preparations.
HB7632 revealed a band of approximately 65kDa corresponding to GAT1 only in the mouse brain P2 fraction corresponding to GAT1’s membrane bound expression. Method: Mouse brain membrane (P2) and cytosol fractions were prepared following previous work (Molnar et al., 1993. Neuroscience 53:307-326) from freshly collected adult brains. Other tissue lysates were prepared following established protocols from freshly dissected tissue (see our guide on WB sample preparation). Samples were loaded (20µg / lane) onto a 10% acrylamide gel alongside a protein ladder (NEB Colour prestained , P7719S) before being run at 60V for 25 minutes followed by 130V for 80 minutes. Wet transfer to a PVDF membrane was completed in 90 minutes using 400mA. The membrane was blocked for 2hrs in 5% non-fat dry milk before being incubated overnight at 4°C in HB7632 at a 1:1,000 dilution (250ng/ml). Following washing the membrane was incubated in secondary antibody (1:10,000 dilution, Polyclonal goat anti-rabbit HRP conjugated, Sigma Aldrich A6154) for 2hrs. For more detail please see our Western blotting protocol. Detection was accomplished using Clarity Western ECL substrate (BioRad, 1705061) and a Licor Odyssey Fc imaging system (ECL channel: 10 min exposure, 700nm channel: 30 sec exposure). Following imaging the membrane was stripped with two changes of stripping buffer (HB7756) before being washed, blocked for 2 hours in 5% non-fat dry milk and incubated in HB9177 (1:4,000 dilution, 0.25µg/ml) overnight at 4°C. Following washing, the membrane was incubated in secondary antibody (1:10,000 dilution, Polyclonal goat anti-mouse HRP conjugated, Sigma Aldrich A3682) for 2hrs and visualised again using Clarity Western ECL substrate (BioRad, 1705061) and a Licor Odyssey Fc imaging system (ECL channel: 4 min exposure, 700nm channel: 30 sec exposure).
Figure 6. The effect of varying HB7632 concentration upon GAT1 staining in rat cerebellum.
HB7632 worked well down to a 1:500 dilution (0.5µg/ml). Method: Brains were dissected from adult rats and fixed for 48hrs in 4% PFA before then incubated in 30% sucrose (in PBS) until the brains had sunk. A freezing microtome was used to cut 40µm transverse slices before sections were incubated in 1% NaBH4 for 30 minutes then 0.05M glycine for 30 minutes. Sections were blocked in 2% BSA, 3% goat serum for 2 hours before incubation overnight in HB7632 ranging in dilution from 1:250 to 1:2000 (1µg/ml to 0.125µg/ml) at 4°C. This was followed by a two hour incubation with secondary antibody (Polyclonal goat anti-rabbit DyLight 488 conjugated, Thermofisher 35552, 1:300 dilution). DAPI (HB0747) was used at 1µg/ml to visualise cell nuclei. For more detail please see our IHC(IF) protocol . Images were captured using a Leica DMi8 inverted epifluorescence microscope (10x objective) in a z-stack (2.8µm spacing) coupled to a Leica DFC365FX monochrome digital camera with DAPI LP and FITC LP filters. Exposure times were as follows:
1:250 – DAPI LP: 31.0ms @ 1x gain, FITC LP: 201.3ms @ 5.6x gain
1:500 – DAPI LP: 31.0ms @ 1x gain, FITC LP: 487.5ms @ 4.5x gain
1:1000 – DAPI LP: 31.0ms @ 1x gain, FITC LP: 487.5ms @ 7.8x gain
1:2000 – DAPI LP: 31.0ms @ 1x gain, FITC LP: 487.5ms @ 7.8x gain
Images were processed in ImageJ (Schindelin et al., 2012. Nat Methods, 9(7), 676–682) using the subtract background (75px rolling ball radius) tool followed by Z-projection, stacking and montage creation.
Figure 7. Concentration response of HB7632 staining in a mouse brain P2 fraction preparation.
HB7632 produced consistent results down to a dilution of 1:2000 (125ng/ml). Method: P2 fractions were prepared from fresh mouse brains following established protocols (Molnar et al., 1993. Neuroscience 53:307-326). Mouse brain P2 fraction samples were loaded (20µg / lane) onto a 10% acrylamide gel alongside a protein ladder (BioRad Precision Plus Dual Colour, 1610374) before being run at 65V for 30 minutes followed by 180V for 60 minutes. Wet transfer to a PVDF membrane was completed in 90 minutes using 400mA. Following transfer the membrane was cut into strips using Ponceau dye to visualise and cut individual lanes. Strips were blocked for 2hrs in 5% non-fat dry milk before being incubated overnight at 4°C in HB7632. Each strip was incubated separately with a separate HB7632 concentration with this ranging from 0.5µg/ml (1:500 dilution) to 7.8ng/ml (1:32,000 dilution). Following washing the membrane was incubated in secondary antibody (1:10,000 dilution, Polyclonal goat anti-rabbit HRP conjugated, Sigma Aldrich A6154) for 2hrs. For more detail please see our Western blotting protocol. Detection was accomplished using Clarity Western ECL substrate (BioRad, 1705061) and a Licor Odyssey Fc imaging system (ECL channel: 10 min exposure, 700nm channel: 30 sec exposure). Band intensity was calculated using Image Studio version 5.2.5 (LiCor) and a graph was constructed in GraphPad Prism 9 using a 3-parameter Hill equation curve fit.
Figure 1. GAT1 staining in GABAergic interneurons of the cerebellum using HB7632.
HB7632 staining reveals the layer of GAT1 containing inhibitory interneurons in the cerebellum. Method: Brains were dissected from adult rats and fixed for 48hrs in 4% PFA before then incubated in 30% sucrose (in PBS) until the brains had sunk. A freezing microtome was used to cut 40µm transverse slices before sections were incubated in 1% NaBH4 for 30 minutes then 0.05M glycine for 30 minutes. Sections were blocked in 2% BSA, 3% goat serum before incubation overnight in HB7632 (1:250, 1µg/ml) at 4°C. This was followed by a two hour incubation with secondary antibody (Polyclonal goat anti-rabbit DyLight 488 conjugated, Thermofisher 35552, 1:300 dilution). DAPI (HB0747) was used at 1µg/ml to visualise cell nuclei. For more detail please see our IHC(IF) protocol . Images were captured using a Leica SPE confocal laser scanning microscope coupled to a Leica DMi8 inverted epifluorescence microscope. The image was captured using a 20x objective, 405nm (24.5% power, gain: 563V) and 488nm (30.1% power, gain: 742V) laser lines in a z-stack (1.63µm spacing). Deconvolution was carried out using Huygens Essential (Scientific Volume Imagine) followed by the stack being flattened using a maximum Z projection in ImageJ (Schindelin et al., 2012. Nat Methods, 9(7), 676–682).
Figure 2. Parvalbumin and GAT1 expressing neurons in rat cerebellum.
Rat cerebellum stained by HB6457 for Parvalbumin (mouse monoclonal) and HB7632 for GAT1 (rabbit polyclonal). Method: Rat brains were dissected and fixed overnight in 4% PFA before then being incubated in 30% sucrose (in PBS) until sunk (approx. 48hrs). A freezing microtome was used to cut 40µm horizontal slices before sections were incubated in 1% NaBH4 for 30 minutes. Sections were blocked in 0.05M glycine, 2% BSA and 3% donkey serum before incubation overnight in HB6457 (1:500, 2µg/ml) and HB7632 (1:500 dilution). This was followed by a two hour incubation with secondary antibodies at a 1:300 dilution (polyclonal goat anti-mouse DyLight488, Thermofisher, 35503 and goat anti-rabbit DyLight 594, Thermofisher 35561). DAPI (HB0747) was used at 1µg/ml to visualise cell nuclei. For more detail please see our IHC(IF) protocol. Images were captured using a Leica DMI6000B inverted epifluorescence microscope. The image was captured as a tilescan using a 40x objective in a z-stack (1.5µm spacing). The image was captured using DAP (5.2ms exposure), L5 (73.5ms exposure) and TX2 (25.0ms exposure) filters. The stack was deconvolved using Huygens professional then flattened using a maximum Z projection in ImageJ (Schindelin et al., 2012. Nat Methods, 9(7), 676–682).
Figure 3. GAT1 staining in the GABAergic interneurons of hippocampal CA1 using HB7632.
HB7632 staining reveals the layer of GAT1 containing inhibitory interneurons in the cerebellum. Method: hippocampi were dissected from rat brains and fixed overnight in 4% PFA before then being incubated in 30% sucrose (in PBS) for another 24hrs. A freezing microtome was used to cut 40µm transverse slices before sections were incubated in 1% NaBH4 then 0.05M glycine for 30 minutes. Section were blocked in 1% BSA, 22.52mg/ml glycine before incubation overnight in HB7632 (1:250 dilution, 1µg/ml). This was followed by a two hour incubation with secondary antibody (Polyclonal goat anti-rabbit DyLight 594 conjugated, Thermofisher 35561, 1:500 dilution). DAPI (HB0747) was used at 1µg/ml to visualise cell nuclei. For more detail please see our IHC(IF) protocol . Images were captured using a Leica DMI6000B inverted epifluorescence microscope (20x objective) coupled to a Photometric-Prime95B monochrome digital camera with DAPI (5.6ms exposure) and TX2 (28.5ms exposure) filters. The image was processed in ImageJ (Schindelin et al., 2012. Nat Methods, 9(7), 676–682) using the subtract background (50px rolling ball radius) tool.
Figure 4. GAT1 expression in rat brain P2 membrane fraction but not other rat tissue lysates and preparations.
HB7632 revealed a band of approximately 65kDa corresponding to GAT1 only in the rat brain P2 fraction corresponding to GAT1’s membrane bound expression. Method: Rat brain membrane (P2) and cytosol fractions were prepared following previous work (Molnar et al., 1993. Neuroscience 53:307-326) from freshly collected adult brains. Other tissue lysates were prepared following established protocols from freshly dissected tissue (see our guide on WB sample preparation). Samples were loaded (20µg / lane) onto a 10% acrylamide gel alongside a protein ladder (NEB Colour prestained , P7719S) before being run at 60V for 25 minutes followed by 130V for 80 minutes. Wet transfer to a PVDF membrane was completed in 90 minutes using 400mA. The membrane was blocked for 2hrs in 5% non-fat dry milk before being incubated overnight at 4°C in HB7632 at a 1:1,000 dilution (250ng/ml). Following washing the membrane was incubated in secondary antibody (1:10,000 dilution, Polyclonal goat anti-rabbit HRP conjugated, Sigma Aldrich A6154) for 2hrs. For more detail please see our Western blotting protocol. Detection was accomplished using Clarity Western ECL substrate (BioRad, 1705061) and a Licor Odyssey Fc imaging system (ECL channel: 10 min exposure, 700nm channel: 30 sec exposure). Following imaging the membrane was stripped with two changes of stripping buffer (HB7756) before being washed, blocked for 2 hours in 5% non-fat dry milk and incubated in HB9177 (1:4,000 dilution, 0.25µg/ml) overnight at 4°C. Following washing, the membrane was incubated in secondary antibody (1:10,000 dilution, Polyclonal goat anti-mouse HRP conjugated, Sigma Aldrich A3682) for 2hrs and visualised again using Clarity Western ECL substrate (BioRad, 1705061) and a Licor Odyssey Fc imaging system (ECL channel: 4 min exposure, 700nm channel: 30 sec exposure).
Figure 5. GAT1 expression in mouse brain P2 membrane fraction but not other mouse tissue lysates and preparations.
HB7632 revealed a band of approximately 65kDa corresponding to GAT1 only in the mouse brain P2 fraction corresponding to GAT1’s membrane bound expression. Method: Mouse brain membrane (P2) and cytosol fractions were prepared following previous work (Molnar et al., 1993. Neuroscience 53:307-326) from freshly collected adult brains. Other tissue lysates were prepared following established protocols from freshly dissected tissue (see our guide on WB sample preparation). Samples were loaded (20µg / lane) onto a 10% acrylamide gel alongside a protein ladder (NEB Colour prestained , P7719S) before being run at 60V for 25 minutes followed by 130V for 80 minutes. Wet transfer to a PVDF membrane was completed in 90 minutes using 400mA. The membrane was blocked for 2hrs in 5% non-fat dry milk before being incubated overnight at 4°C in HB7632 at a 1:1,000 dilution (250ng/ml). Following washing the membrane was incubated in secondary antibody (1:10,000 dilution, Polyclonal goat anti-rabbit HRP conjugated, Sigma Aldrich A6154) for 2hrs. For more detail please see our Western blotting protocol. Detection was accomplished using Clarity Western ECL substrate (BioRad, 1705061) and a Licor Odyssey Fc imaging system (ECL channel: 10 min exposure, 700nm channel: 30 sec exposure). Following imaging the membrane was stripped with two changes of stripping buffer (HB7756) before being washed, blocked for 2 hours in 5% non-fat dry milk and incubated in HB9177 (1:4,000 dilution, 0.25µg/ml) overnight at 4°C. Following washing, the membrane was incubated in secondary antibody (1:10,000 dilution, Polyclonal goat anti-mouse HRP conjugated, Sigma Aldrich A3682) for 2hrs and visualised again using Clarity Western ECL substrate (BioRad, 1705061) and a Licor Odyssey Fc imaging system (ECL channel: 4 min exposure, 700nm channel: 30 sec exposure).
Figure 6. The effect of varying HB7632 concentration upon GAT1 staining in rat cerebellum.
HB7632 worked well down to a 1:500 dilution (0.5µg/ml). Method: Brains were dissected from adult rats and fixed for 48hrs in 4% PFA before then incubated in 30% sucrose (in PBS) until the brains had sunk. A freezing microtome was used to cut 40µm transverse slices before sections were incubated in 1% NaBH4 for 30 minutes then 0.05M glycine for 30 minutes. Sections were blocked in 2% BSA, 3% goat serum for 2 hours before incubation overnight in HB7632 ranging in dilution from 1:250 to 1:2000 (1µg/ml to 0.125µg/ml) at 4°C. This was followed by a two hour incubation with secondary antibody (Polyclonal goat anti-rabbit DyLight 488 conjugated, Thermofisher 35552, 1:300 dilution). DAPI (HB0747) was used at 1µg/ml to visualise cell nuclei. For more detail please see our IHC(IF) protocol . Images were captured using a Leica DMi8 inverted epifluorescence microscope (10x objective) in a z-stack (2.8µm spacing) coupled to a Leica DFC365FX monochrome digital camera with DAPI LP and FITC LP filters. Exposure times were as follows:
1:250 – DAPI LP: 31.0ms @ 1x gain, FITC LP: 201.3ms @ 5.6x gain
1:500 – DAPI LP: 31.0ms @ 1x gain, FITC LP: 487.5ms @ 4.5x gain
1:1000 – DAPI LP: 31.0ms @ 1x gain, FITC LP: 487.5ms @ 7.8x gain
1:2000 – DAPI LP: 31.0ms @ 1x gain, FITC LP: 487.5ms @ 7.8x gain
Images were processed in ImageJ (Schindelin et al., 2012. Nat Methods, 9(7), 676–682) using the subtract background (75px rolling ball radius) tool followed by Z-projection, stacking and montage creation.
Figure 7. Concentration response of HB7632 staining in a mouse brain P2 fraction preparation.
HB7632 produced consistent results down to a dilution of 1:2000 (125ng/ml). Method: P2 fractions were prepared from fresh mouse brains following established protocols (Molnar et al., 1993. Neuroscience 53:307-326). Mouse brain P2 fraction samples were loaded (20µg / lane) onto a 10% acrylamide gel alongside a protein ladder (BioRad Precision Plus Dual Colour, 1610374) before being run at 65V for 30 minutes followed by 180V for 60 minutes. Wet transfer to a PVDF membrane was completed in 90 minutes using 400mA. Following transfer the membrane was cut into strips using Ponceau dye to visualise and cut individual lanes. Strips were blocked for 2hrs in 5% non-fat dry milk before being incubated overnight at 4°C in HB7632. Each strip was incubated separately with a separate HB7632 concentration with this ranging from 0.5µg/ml (1:500 dilution) to 7.8ng/ml (1:32,000 dilution). Following washing the membrane was incubated in secondary antibody (1:10,000 dilution, Polyclonal goat anti-rabbit HRP conjugated, Sigma Aldrich A6154) for 2hrs. For more detail please see our Western blotting protocol. Detection was accomplished using Clarity Western ECL substrate (BioRad, 1705061) and a Licor Odyssey Fc imaging system (ECL channel: 10 min exposure, 700nm channel: 30 sec exposure). Band intensity was calculated using Image Studio version 5.2.5 (LiCor) and a graph was constructed in GraphPad Prism 9 using a 3-parameter Hill equation curve fit.
Product information
Immunogen
Synthetic peptide corresponding to the C-terminal region of rat GAT1 conjugated to KLH
125ng/ml (1:2,000) as tested in a mouse brain P2 membrane preparation
IHC(IF) optimal concentration
500ng/ml (1:500) as tested in rat cerebellum sections
Positive control
GAT1 is highly expressed within the GABAergic interneurones of the CNS therefore brain samples (and especially membrane enriched samples) make an excellent positive control. GAT1 expression has also been reported in K-562, Hel and HMC-1 cell lines (see the human protein atlas for more information).
Negative control
GAT1 is poorly expressed in peripheral tissues therefore these make a good negative control. Adittionally the majority of cell lines, including HEK293, HeLa and SH-SY5Y cells, do not express GAT1.
Sodium- and chloride-dependent GABA transporter 1, SLC6A1, Solute carrier family 6 member 1
UniProt ID
P30531
Structure image
Gene name
SLC6A1
NCBI full gene name
solute carrier family 6 member 1
Entrez gene ID
6529
Amino acids
599 (67.1kDa)
Isoforms
GAT1 only has one described isoform.
Expression
GAT1 is primarily expressed in GABAergic interneurones within the CNS. There is also expression at a lower level in some peripheral organs (see Erdo and Wolff, 1990). There have also been reports of GAT1 residing within astrocytic processes in the CNS (see Minelli et al., 1995).
Subcellular expression
GAT1 is expressed in the plasma membrane and is enriched in axon terminals.
Target function
GAT1 is a transmembrane re-uptake transporter that removes GABA from the synaptic cleft into presynaptic neurones and astrocytes.
Processing
None
Post translational modifications
GAT1 is subject to phosphorylation on Ser18 and Ser591 alongside N-linked glycosylation on residues 176, 181 and 184
Homology (compared to human)
Mouse and rat GAT1 proteins are identical to each other and both have a 98% identity to human GAT1 in a BLAST search. This corresponds to 12 amino acid changes compared to the human sequence.
Similar proteins
GAT2 and GAT3 have a 52.1% and 54.6% identity to GAT1 in a BLAST search. These were the only identified proteins with significant homology with GAT1.
Storage & Handling
Storage instructions
-20°C
Shipping Conditions
On ice
Important
This product is for RESEARCH USE ONLY and is not intended for therapeutic or diagnostic use. Not for human or veterinary use
What counterstains do you recommend for use in ICC and IHC with this antibody?
We recommend using either DAPI or Hoechst 33342 to label cell nuclei. In some experiments it is also helpful to label actin filaments in the cytoskeleton using a Phalloidin conjugate such as FITC Phalloidin or Rhodamine Phalloidin-TRITC.
Antibody to GAT1 - GABA reuptake transporter and marker for GABAergic interneurones. Part of the ValidAb™ range of highly validated, data-rich antibodies.


 Western Blot Protocol (1 MB)