Antibody to GFP - green coloured fluorescent protein widely used as a tag in molecular biology. Part of the ValidAb™ range of highly validated, data-rich antibodies.
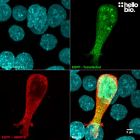
Figure 1. pEGFP-C2 transfected HEK293T cells showing co-localised staining of EGFP and HB8365.
Signals derived from EGFP and HB8365 completely overlap therefore showing strong evidence of antibody specificity. Method: HEK293T cells were cultured and transfected following established protocols (Lee et al., 2019. PLoS ONE, 14(5):e0213116) with a pEGFP-C2 plasmid. After allowing cells time to express, fixation was carried out using 4% PFA. Cells were permeabilised with 0.1% Triton X-100 followed by blocking in 1% BSA, 300mM glycine. HB8365 was incubated overnight (4°C) at a 1:32,000 dilution (0.31µg/ml) followed by a one hour incubation with secondary antibody (Polyclonal donkey anti-chicken Alexa Fluor 647 conjugated, 1:300 dilution). DAPI (HB0747) was used at 1µg/ml to visualise cell nuclei. For more detail please see our ICC protocol. Images were captured using a Leica DMi6000B inverted epifluorescence microscope. The image was captured using a 100x objective with DAP (2ms exposure), L5 (150ms exposure) and Y5 (10ms exposure) filters in a z-stack (0.22 µm spacing). Deconvolution was carried out using Huygens Essential (Scientific Volume Imagine) followed by the stack being flattened using a maximum Z projection in ImageJ (Schindelin et al., 2012. Nat Methods, 9(7), 676–682).
Figure 2. pEGFP-C2 transfected HEK293T cells showing co-localised staining of EGFP and HB8365 in EGFP+ but not WT cells.
HB8365 shows strong colocalization and a high signal/noise ratio in EGFP+ HEK293T cells but not untransfected wild type cells. Method: HEK293 cells were cultured and transfected following established protocols (Lee et al., 2019. PLoS ONE, 14(5):e0213116) with a pEGFP-C2 plasmid. Wild type cells were subject to the same transformation protocol without the addition of transfection mix. After allowing cells 48 hours to express, fixation was carried out using 4% PFA. Cells were permeabilised with 0.1% Triton X-100 followed by blocking in 1% BSA, 300mM glycine. HB8365 was incubated overnight (4°C) at 1:2000 and 1:4,000 dilutions (2.5 and 5µg/ml) followed by a one hour incubation with secondary antibody (Polyclonal donkey anti-chicken Alexa Fluor 647 conjugated, 1:300 dilution). DAPI (HB0747) was used at 1µg/ml to visualise cell nuclei. For more detail please see our ICC protocol. Images were captured using a Leica DMI6000B inverted epifluorescence microscope attached to a Photometric-Prime95B camera. Images were captured as a z-stack using a 40x objective with the following exposures:
Deconvolution was carried out using Huygens Essential (Scientific Volume Imagine) followed by the stack being flattened using a maximum Z projection in ImageJ (Schindelin et al., 2012. Nat Methods, 9(7), 676–682).
Figure 3. Specific HB8365 staining only in pEGFP-C2 transfected HEK293T cells.
HB8365 revealed 29 and 23kDa bands only present in pEGFP-C2 transfected cells without any cross-reactivity with mCherry or native proteins in either HEK293T cells or liver lysate samples. Method: HEK293 cells were cultured and transfected following established protocols (Lee et al., 2019. PLoS ONE, 14(5):e0213116) with either pEGFP-C2 or pmCherry-C3 plasmids. Liver lysates were prepared following established protocols from freshly dissected tissue (see our guide on WB sample preparation). After allowing 2 days for plasmid expression, HEK293T lysates were prepared and loaded (equal loading) onto a 4-20% acrylamide gel alongside liver lysate samples (20µg / lane) and a protein ladder. Gels were run at 160V for 45 minutes before being wet transfer to a PVDF membrane which was completed in 90 minutes using 400mA. The membrane was blocked for 2hrs in 5% non-fat dry milk before being incubated overnight at 4°C in HB8365 at a 1:5,000 dilution (2µg/ml). Following washing, the membrane was incubated in secondary antibody (1:10,000 dilution, Polyclonal goat anti-chicken HRP conjugated, Thermofisher SA1300) for 2hrs. For more detail please see our Western blotting protocol. Detection was accomplished using Clarity Western ECL substrate (BioRad, 1705061) and a Licor Odyssey Fc imaging system (ECL channel: 5 min exposure, 700nm channel: 30 sec exposure). Following imaging the membrane was stripped with two changes of stripping buffer (HB7756) before being washed, blocked for 1 hour in 5% non-fat dry milk and incubated in HB9177 (mouse monoclonal anti-GAPDH, 1:4,000 dilution, 250ng/ml) for 2 hours at room temperature. Following washing the membrane was incubated in secondary antibody (1:10,000 dilution, Polyclonal goat anti-mouse HRP conjugated, Sigma Aldrich A3682) for 1 hour and visualised again using Clarity Western ECL substrate (BioRad, 1705061) and a Licor Odyssey Fc imaging system (ECL channel: 4 min exposure, 700nm channel: 30 sec exposure).
Figure 4. Concentration response of HB8365 staining in pEGFP-C2 transfected HEK293T cells.
HB8365 shows strong staining at dilutions as low as 1:32,000 with minimal background. Method: HEK293T cells were cultured and transfected following established protocols (Lee et al., 2019. PLoS ONE, 14(5):e0213116) with a pEGFP-C2 plasmid. After a 48 hour incubation to allow cells time to express, fixation was carried out using 4% PFA. Cells were permeabilised with 0.1% Triton X-100 followed by blocking in 1% BSA, 300mM glycine. HB8365 was incubated overnight (4°C) at dilutions ranging from 1:1,000 to 1:32,000 (0.31-10µg/ml). This was followed by a one-hour incubation with secondary antibody (Polyclonal donkey anti-chicken Alexa Fluor 647 conjugated, 1:300 dilution). DAPI (HB0747) was used at 1µg/ml to visualise cell nuclei. For more detail please see our ICC protocol. Images were captured using a Leica DMI6000B inverted epifluorescence microscope attached to a Photometric-Prime95B camera. Images were captured using a 40x objective as a z-stack using the following exposure settings:
1:1,000; DAP: 2ms, L5: 50ms, Y5: 1ms
1:2,000; DAP: 2ms, L5: 30ms, Y5: 1ms
1:4,000; DAP: 2ms, L5: 20ms, Y5: 2ms
1:8,000; DAP: 2ms, L5: 80ms, Y5: 4ms
1:16,000; DAP: 2ms, L5: 80ms, Y5: 8ms
1:32,000; DAP: 2ms, L5: 40ms, Y5: 10ms
Deconvolution was carried out using Huygens Essential (Scientific Volume Imagine) followed by the stack being flattened using a maximum Z projection in ImageJ (Schindelin et al., 2012. Nat Methods, 9(7), 676–682).
Figure 5. pEGFP-C2 transfected HEK293T cells showing co-localized staining of EGFP and HB8365.
Signals derived from EGFP and HB8365 completely overlap therefore showing strong evidence of antibody specificity. Method: HEK293T cells were cultured and transfected following established protocols (Lee et al., 2019. PLoS ONE, 14(5):e0213116) with a pEGFP-C2 plasmid. After allowing cells time to express, fixation was carried out using 4% PFA. Cells were permeabilised with 0.1% Triton X-100 followed by blocking in 1% BSA, 300mM glycine. HB8365 was incubated overnight (4°C) at a 1:32,000 dilution (0.31µg/ml) followed by a one hour incubation with secondary antibody (Polyclonal donkey anti-chicken Alexa Fluor 647 conjugated, 1:300 dilution). DAPI (HB0747) was used at 1µg/ml to visualise cell nuclei. For more detail please see our ICC protocol. Images were captured using a Leica DMi6000B inverted epifluorescence microscope. The image was captured using a 100x objective with DAP (2ms exposure), L5 (150ms exposure) and Y5 (10ms exposure) filters in a z-stack (0.22 µm spacing). Deconvolution was carried out using Huygens Essential (Scientific Volume Imagine) followed by the stack being flattened using a maximum Z projection in ImageJ (Schindelin et al., 2012. Nat Methods, 9(7), 676–682).
Figure 6. Concentration response of HB6381 staining in pEGFP-C2 transfected HEK293 cells.
HB8365 shows consistent results at dilutions as low as 1:64,000 (0.15µg/ml). Method: HEK293 cells were cultured and transfected following established protocols (Lee et al., 2019. PLoS ONE, 14(5):e0213116) with a pEGFP-C2 plasmid. After allowing 48hrs for expression, lysate was prepared and loaded (equal loading) onto a 4-20% acrylamide gel alongside a protein ladder before being run at 160V for 45 minutes. Wet transfer to a PVDF membrane was completed in 90 minutes using 400mA. Following transfer, the membrane was cut into strips using Ponceau dye to visualise and cut individual lanes. Strips were blocked for 3hrs in 5% non-fat dry milk before being incubated overnight at 4°C in HB8365. Each strip was incubated separately with a separate HB8365 concentration with this ranging from 10µg/ml (1:1,000 dilution) to 0.07µg/ml (1:128,000 dilution). Following washing, the membrane was incubated in secondary antibody (1:10,000 dilution, Polyclonal goat anti-chicken HRP conjugated, Thermofisher SA1300) for 2hrs. For more detail please see our Western blotting protocol. Detection was accomplished using Clarity Western ECL substrate (BioRad, 1705061) and a Licor Odyssey Fc imaging system (ECL channel: 8 min exposure, 700nm channel: 30 sec exposure). Band intensity was calculated using Image Studio version 5.2.5 (LiCor) and a graph was constructed in GraphPad Prism 9 using a 3-parameter Hill equation curve fit. Following imaging the membrane was stripped with two changes of stripping buffer (HB7756) before being washed, blocked for 1 hour in 5% non-fat dry milk and incubated in HB9177 (mouse monoclonal anti-GAPDH, 1:4,000 dilution, 250ng/ml) for 2 hours at room temperature. Following washing the membrane was incubated in secondary antibody (1:10,000 dilution, Polyclonal goat anti-mouse HRP conjugated, Sigma Aldrich A3682) for 1 hour and visualised again using Clarity Western ECL substrate (BioRad, 1705061) and a Licor Odyssey Fc imaging system (ECL channel: 4 min exposure, 700nm channel: 30 sec exposure).
Figure 7. Confocal image of pEGFP-C2 transfected HEK293T showing bleaching of EGFP signal but not HB8365 derived signal.
EGFP bleaches relatively easily from high intensity illumination such as that found on a confocal microscope. One of the advantages of using an anti-GFP antibody to supplement signal is the enhanced photostability of the fluorophore conjugated secondary antibody. Method: HEK293T cells were cultured and transfected following established protocols (Lee et al., 2019. PLoS ONE, 14(5):e0213116) with a pEGFP-C2 plasmid. After allowing cells time to express, fixation was carried out using 4% PFA. Cells were permeabilised with 0.1% Triton X-100 followed by blocking in 1% BSA, 300mM glycine. HB8365 was incubated overnight (4°C) at a 1:8,000 dilution (1.25µg/ml) followed by a one hour incubation with secondary antibody (Polyclonal donkey anti-chicken Alexa Fluor 647 conjugated, 1:300 dilution). DAPI (HB0747) was used at 1µg/ml to visualise cell nuclei. For more detail please see our ICC protocol. Images were captured using a Leica SP8 AOBS confocal laser scanning microscope attached to a Leica DM I8 inverted epifluorescence microscope. The image was captured in Lightning deconvolution mode using a 63x objective (3.5x zoom), 405nm (30.0% power, HyD: 27% gain), 488nm (7.7% power, HyD: 94% gain) and 633nm (1% power, HyD: 22% gain) laser lines in a z-stack (0.49 µm spacing). Following capture, the stack was flattened using a maximum Z projection in ImageJ (Schindelin et al., 2012. Nat Methods, 9(7), 676–682).
Product information
Immunogen
GFP expressed in and purified from E.coli
Purification
Mixture of immunogen affinity purified antibody and purified IgY.
Concentration
10mg/ml
Formulation
50% PBS, 50% glycerol with 0.02% sodium azide
Predicted species reactivity
Species Independent
Tested species reactivity
Species Independent
Tested applications
Applications
ICC, WB
Western blot optimal concentration
Dependent upon sample GFP expression. We observed a 1:8,000 dilution to be optimal in pEGFP-C2 transfected HEK293 cells.
ICC optimal concentration
Dependent upon sample GFP expression. We observed a 1:8,000 dilution to be optimal in pEGFP-C2 transfected HEK293 cells.
Positive control
Any tissue or cell sample that has been engineered to express GFP.
Exogenously expressed only. Not expressed natively in mammalian cells.
Subcellular expression
GFP is generally expressed cytosolically in basic constructs however expression can be directed to any cellular compartment through GFP-tagged proteins that naturally express in only certain compartments.
Target function
None. Used widely in research to visualise specific proteins through GFP-tagged recombinant constructs.
Processing
NA
Post translational modifications
NA
Homology (compared to human)
NA
Similar proteins
EGFP (enhanced GFP, 26.9kDa) and YFP (yellow fluorescent protein, 26.4kDa) are both extremely similar.
Storage & Handling
Storage instructions
-20°C
Shipping Conditions
On ice
Important
This product is for RESEARCH USE ONLY and is not intended for therapeutic or diagnostic use. Not for human or veterinary use
What counterstains do you recommend for use in ICC and IHC with this antibody?
We recommend using either DAPI or Hoechst 33342 to label cell nuclei. In some experiments it is also helpful to label actin filaments in the cytoskeleton using a Phalloidin conjugate such as FITC Phalloidin or Rhodamine Phalloidin-TRITC.
Does this GFP antibody cross-react with mCherry?
We have tested and found no cross-reactivity between this GFP antibody and mCherry in Western blot experiments.
What guarantee do you have that my GFP antibody will perform as expected?
We guarantee that your GFP antibody will work for the applications and species we list on the datasheet. If the antibody fails to perform as expected then we are happy to offer a 100% refund guarantee. For more details please see our guarantee policy.
What protocols are available for use with this GFP antibody
We have made a comprehensive collection of protocols that we have used in our experiments to validate this GFP antibody.
What counterstains do you recommend for use in ICC and IHC with this GFP antibody?
We recommend using either DAPI or Hoechst 33342 to label cell nuclei. In some experiments it is also helpful to label actin filaments in the cytoskeleton using a Phalloidin conjugate such as FITC Phalloidin or Rhodamine Phalloidin-TRITC.
Antibody to GFP - green coloured fluorescent protein widely used as a tag in molecular biology. Part of the ValidAb™ range of highly validated, data-rich antibodies.
Antibody to GFP - green coloured fluorescent protein widely used as a tag in molecular biology. Part of the ValidAb™ range of highly validated, data-rich antibodies.
Monoclonal antibody (IgM) to GFP - green coloured fluorescent protein widely used as a tag in molecular biology. Part of the ValidAb™ range of highly validated, data-rich antibodies.


 Western Blot Protocol (1 MB)