Monoclonal antibody to Vimentin - class III intermediate filament expressed in mesenchymal cells used as a marker of epithelial-mesenchymal transition. Part of the ValidAb™ range of highly validated, data-rich antibodies.
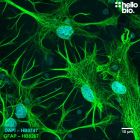
Figure 1. Vimentin expression in glia within a cultured rat neuron preparation.
HB6497 reveals the dense network of vimentin containing intermediate filaments present within the glia found within mixed neuronal cultures. Method: neurones were cultured from PND2 rats following established protocols (Brewer and Torricelli, 2007. Nat Protoc 2, 1490–1498) and fixed with 4% PFA on DIV21. Cells were permeabilised with 0.1% Triton X-100 before being blocked in 1% BSA, 300mM glycine. Cells were incubated overnight at 4°C in HB6497 (1µg/ml, 1:1000) before being incubated in secondary antibody (goat polyclonal anti-mouse Dy488, Thermofisher 35503, 1:300) for 1 hour at RT. Nuclei were counterstained using DAPI (HB0747, 1µg/ml). For more detail please see our ICC protocol. Images were captured using a Leica SPE confocal laser scanning microscope coupled to a Leica DMi8 inverted epifluorescence microscope. The image was captured using a 63x objective, 405nm (28.9% power, gain: 599V) and 488nm (28.9% power, gain: 569V) laser lines in a z-stack (0.28 µm spacing). Deconvolution was carried out using Huygens Essential version (Scientific Volume Imagine) followed by the stack being flattened using a maximum Z projection in ImageJ (Schindelin et al., 2012. Nat Methods, 9(7), 676–682).
Figure 2. Independent antibody validation of HB6497 in glia within a cultured rat neuron preparation
Both HB6497 (mouse monoclonal) and HB7843 (goat polyclonal) immunoreactivity within mixed neuronal cultures overlaps therefore providing evidence for antibody specificity. Method: neurones were cultured from PND2 rats following established protocols (Brewer and Torricelli, 2007. Nat Protoc 2, 1490–1498) and fixed with 4% PFA on DIV21. Cells were permeabilised with 0.1% Triton X-100 before being blocked in 1% BSA, 300mM glycine. Cells were incubated overnight at 4°C in HB6497 (1µg/ml, 1:1000) and HB7843 (2µg/ml, 1:500). Secondary antibodies were incubated for 1 hour at RT (donkey polyclonal anti-mouse Dy488, Thermofisher SA5-10166, 1:300 and donkey polyclonal anti-goat Dy594, Thermofisher SA5-10088, 1:300) before nuclei were counterstained using DAPI (HB0747, 1µg/ml). For more detail please see our ICC protocol. Images were captured using a Leica SPE confocal laser scanning microscope coupled to a Leica DMi8 inverted epifluorescence microscope. The image was captured in Lightning deconvolution mode using a 63x objective with 0.27µm z-spacing, 405nm (11.8% power @ 825V gain (PMT)), 561nm (1.0% power @ 10.8% gain (Hyd)) and 496nm (0.5% power @ 27.1% gain (HyD)) lasers. Following capture the stack was flattened using a maximum Z projection in ImageJ (Schindelin et al., 2012. Nat Methods, 9(7), 676–682).
Figure 3. Vimentin expression in glia within a cultured rat neuron preparation.
HB6497 reveals the dense network of vimentin containing intermediate filaments present within the glia found within mixed neuronal cultures. Method: neurones were cultured from PND2 rats following established protocols (Brewer and Torricelli, 2007. Nat Protoc 2, 1490–1498) and fixed with 4% PFA on DIV21. Cells were permeabilised with 0.1% Triton X-100 before being blocked in 1% BSA, 300mM glycine. Cells were incubated overnight at 4°C in HB6497 (1µg/ml, 1:1000) before being incubated in secondary antibody (goat polyclonal anti-mouse Dy488, Thermofisher 35503, 1:300) for 1 hour at RT. Nuclei were counterstained using DAPI (HB0747, 1µg/ml). For more detail please see our ICC protocol. Images were captured using a Leica SPE confocal laser scanning microscope coupled to a Leica DMi8 inverted epifluorescence microscope. The image was captured in Lightning deconvolution mode using a 63x objective with 0.16µm z-spacing, 405nm (6.0% power @ 672.5V gain (PMT)) and 496nm (0.6% power @ 10% gain (Hyd)) lasers. Following capture the stack was flattened using a maximum Z projection in ImageJ (Schindelin et al., 2012. Nat Methods, 9(7), 676–682).
Figure 4. Concentration response of HB6497 in glia within a cultured rat neuron preparation
HB6497 produces strong staining of glial cells within mixed neuronal cultures at concentrations as low at 0.25µg/ml (1:4000). Method: neurones were cultured from PND2 rats following established protocols (Brewer and Torricelli, 2007. Nat Protoc 2, 1490–1498) and fixed with 4% PFA on DIV21. Cells were permeabilised with 0.1% Triton X-100 before being blocked in 1% BSA, 300mM glycine. Cells were incubated overnight at 4°C in HB6497 (concentrations ranging from 2µg/ml (1:500) to 0.25µg/ml(1:4000)) before being incubated in secondary antibody (polyclonal goat anti-mouse Dy488, Thermofisher 35503, 1:300) for 1 hour at RT. Nuclei were counterstained using DAPI (HB0747, 1µg/ml); for more detail please see our ICC protocol. Images were captured with a Leica DMi8 inverted epifluorescence widefield microscope attached to a Leica DFC365FX monochrome digital camera. Images were taken at 20x magnification in a z-stack with the following exposure settings:
Following capture, ImageJ (Schindelin et al., 2012. Nat Methods, 9(7), 676–682) was used to subtract background and perform a maximum Z projection.
Figure 5. Independent antibody validation of HB6497 in glia within a cultured rat neurone preparation
Both HB6497 (mouse monoclonal) and HB7843 (goat polyclonal) immunoreactivity within mixed neuronal cultures overlaps therefore providing evidence for antibody specificity. Method: neurones were cultured from PND2 rats following established protocols (Brewer and Torricelli, 2007. Nat Protoc 2, 1490–1498) and fixed with 4% PFA on DIV21. Cells were permeabilised with 0.1% Triton X-100 before being blocked in 1% BSA, 300mM glycine. Cells were incubated overnight at 4°C in HB6497 (1µg/ml, 1:1000) and HB7843 (2µg/ml, 1:500). Secondary antibodies were incubated for 1 hour at RT (donkey polyclonal anti-mouse Dy488, Thermofisher SA5-10166, 1:300 and donkey polyclonal anti-goat Dy594, Thermofisher SA5-10088, 1:300) before nuclei were counterstained using DAPI (HB0747, 1µg/ml). For more detail please see our ICC protocol. Images were captured using a Leica SPE confocal laser scanning microscope coupled to a Leica DMi8 inverted epifluorescence microscope. The image was captured in Lightning deconvolution mode using a 63x objective with 0.27µm z-spacing, 405nm (11.8% power @ 825V gain (PMT)), 561nm (1.0% power @ 10.8% gain (Hyd)) and 496nm (0.5% power @ 27.1% gain (HyD)) lasers. Following capture the stack was flattened using a maximum Z projection in ImageJ (Schindelin et al., 2012. Nat Methods, 9(7), 676–682).
Figure 6. Vimentin labelled glia and Neurofilament light labelled neurons in a cultured rat neuron preparation.
HB6497 labels the vimentin containing glia surrounding neurones (labelled for NFL with HB7266) in culture. Method: neurones were cultured from PND2 rats following established protocols (Brewer and Torricelli, 2007. Nat Protoc 2, 1490–1498) and fixed with 4% PFA on DIV21. Cells were permeabilised with 0.1% Triton X-100 before being blocked in 1% BSA, 300mM glycine. Cells were incubated overnight at 4°C in HB6497 (mouse monoclonal anti-vimentin, 1:1000, 1µg/ml) and HB7266 (rabbit monoclonal anti-nfl, 1:4000, 0.25µg/ml). Following washing, coverslips were incubated with secondary antibodies (polyclonal goat anti-mouse Dy488, Thermofisher 35503, 1:300 and polyclonal goat anti-rabbit Dy594, Thermofisher, 35561, 1:300). Hoechst 33342 (HB0787) was used at 1.1µg/ml for 15mins to visualise nuclei. For more detail please see our ICC protocol. Images were captured using a Leica SPE confocal laser scanning microscope coupled to a Leica DMi8 inverted epifluorescence microscope. The image was captured in Lightning deconvolution mode using a 63x objective, 0.25µm z-spacing, 405nm (20.0% power @ 893.7V gain (PMT)), 561nm (0.5% power @ 14.3% gain (Hyd)) and 496nm (0.5% power @ 10.0% gain (HyD)) lasers. Following capture the stack was flattened using a maximum Z projection in ImageJ (Schindelin et al., 2012. Nat Methods, 9(7), 676–682).
Figure 7. Vimentin expression in glia found within a cultured rat neuron preparation revealed using HB6497.
HB6497 staining reveals a cluster of glia found within a mixed neuronal culture from P2 rats. Method: neurones were cultured from PND2 rats following established protocols (Brewer and Torricelli, 2007. Nat Protoc 2, 1490–1498) and fixed with 4% PFA on DIV21. Cells were permeabilised with 0.1% Triton X-100 before being blocked in 1% BSA, 300mM glycine. Cells were incubated overnight at 4°C in HB6497 (0.25µg/ml, 1:4000) before being incubated in secondary antibody (polyclonal goat anti-mouse Dy488, Thermofisher 35503, 1:300) for 1 hour at RT. Nuclei were counterstained using DAPI (HB0747, 1µg/ml); for more detail please see our ICC protocol. Images were captured using a Leica SPE confocal laser scanning microscope coupled to a Leica DMi8 inverted epifluorescence microscope. The image was captured using a 20x objective, 405nm (45.6% power, gain: 780V) and 488nm (31.2% power, gain: 777V) laser lines in a z-stack (3.1µm spacing). Deconvolution was carried out using Huygens Essential version (Scientific Volume Imagine) followed by the stack being flattened using a maximum Z projection in ImageJ (Schindelin et al., 2012. Nat Methods, 9(7), 676–682).
Figure 8. HB6497 immunoreactivity in a range of cell and tissue lysates.
HB6497 revealed a band corresponding with Vimentin at 58.8kDa in human cell line samples and a rat brain cytosol preparation. There was no immunoreactivity in other samples or mouse brain. Method: mouse brain and rat brain cytosol fractions were prepared following previous work (Molnar et al., 1993. Neuroscience 53:307-326) from freshly collected adult brains. Other tissue lysates were prepared following established protocols from freshly dissected tissue (see our guide on WB sample preparation). HEK293 and HeLa cells were cultured in 10% FBS, 1% pen/strep in DMEM before having proteins extracted. Samples were loaded (20µg / lane) onto a 12% acrylamide gel alongside a protein ladder (Biorad precision plus dual colour, 1610374) before being run at 60V for 45 minutes followed by 120V for 90 minutes. Wet transfer to a PVDF membrane was completed in 90 minutes using 400mA. The membrane was blocked for 1hr in 5% non-fat dry milk before being incubated overnight at 4°C in HB6497 at a 1:5,000 dilution (0.2µg/ml). Following washing, the membrane was incubated in secondary antibody (1:10,000 dilution, Polyclonal goat anti-mouse HRP conjugated, Sigma Aldrich A3682) for 2hrs. For more detail please see our Western blotting protocol. Detection was accomplished using Clarity Western ECL substrate (BioRad, 1705061) and a Licor Odyssey Fc imaging system (ECL channel: 10 min exposure, 700nm channel: 30 sec exposure). Following imaging, the membrane was stripped with two changes of stripping buffer (HB7756) before being washed, blocked for 30 minutes in 1% fish skin gelatin and incubated in HB9177 (1:4,000 dilution, 0.25µg/ml) for 3 days at 4°C. Following washing, the membrane was incubated in secondary antibody (1:10,000 dilution, Polyclonal goat anti-mouse HRP conjugated, Sigma Aldrich A3682) for 2hrs and visualised again using Clarity Western ECL substrate (BioRad, 1705061) and a Licor Odyssey Fc imaging system (ECL channel: 2 min exposure, 700nm channel: 30 sec exposure).
Figure 9. Concentration response of vimentin expression within HEK293 cell lysate.
HB6497 produced consistent results at concentrations as low as 1:16,000 (62.5ng/ml) when tested in HEK293T lysate. Method: HEK293 cells were cultured following established protocols (Lee et al., 2019. PLoS ONE, 14(5):e0213116) before lysate was prepared (see our guide on WB sample preparation) and loaded loaded (equal loading) onto a 12% acrylamide gel alongside a protein ladder (Biorad precision plus dual colour, 1610374) before being run at 60V for 50 minutes followed by 130V for 100 minutes. Wet transfer to a PVDF membrane was completed in 90 minutes using 400mA. Following transfer the membrane was cut into strips using Ponceau dye to visualise and cut individual lanes. Strips were blocked for 2hrs in 5% non-fat dry milk before being incubated overnight at 4°C in HB6497. Each strip was incubated separately with a separate HB6497 concentration with this ranging from 1000ng/ml (1:1000 dilution) to 31.3ng/ml (1:32,000 dilution). Following washing the membrane was incubated in secondary antibody (1:10,000 dilution, Polyclonal goat anti-mouse HRP conjugated, Sigma Aldrich A3682) for 2hrs. For more detail please see our Western blotting protocol. Detection was accomplished using Clarity Western ECL substrate (BioRad, 1705061) and a Licor Odyssey Fc imaging system (ECL channel: 10 min exposure, 700nm channel: 30 sec exposure). Band intensity was calculated using Image Studio version 5.2.5 (LiCor) and a graph was constructed in GraphPad Prism 9 using a 3-parameter Hill equation curve fit.
Figure 10. Vimentin expression revealed around the edges of cerebral ventricles in rat brain.
HB6497 reveals the dense collection of vimentin expressing cells found in the border of cerebral ventricles in rat brain. Method: Brains were dissected from adult rats and fixed for 48hrs in 4% PFA before then incubated in 30% sucrose (in PBS) until the brains had sunk. A freezing microtome was used to cut 40µm horizontal slices before sections were incubated in 1% NaBH4 for 30 minutes then 0.05M glycine for 30 minutes. Sections were blocked in 2% BSA, 3% goat serum before incubation overnight in HB6497 (1:1000, 1µg/ml) at 4°C. This was followed by a two hour incubation with secondary antibody (Polyclonal goat anti-mouse DyLight 488 conjugated, Thermofisher 35503, 1:300 dilution). DAPI (HB0747) was used at 1µg/ml to visualise cell nuclei. For more detail please see our IHC(IF) protocol. Images were captured using a Leica SPE confocal laser scanning microscope coupled to a Leica DMi8 inverted epifluorescence microscope. The image was captured using a 63x objective, 405nm (18.9% power, PMT: 530V) and 488nm (25.6% power, PMT: 667V) laser lines in a z-stack (0.7µm spacing). Deconvolution was carried out using Huygens Essential version (Scientific Volume Imagine) followed by the stack being flattened using a maximum Z projection in ImageJ (Schindelin et al., 2012. Nat Methods, 9(7), 676–682).
Figure 11. Vimentin expression in HEK293T cells revealed using HB6497
HB6497 reveals the network of vimentin containing intermediate filaments present in HEK293T cells. Method: HEK293T cells were cultured in 10% FBS, 1% pen/strep in DMEM before being fixed in 4% PFA. Cells were incubated overnight at 4°C in HB6497 (0.5µg/ml, 1:2000) before being incubated in secondary antibody (polyclonal goat anti-mouse Dy488 conjugated, Thermofisher 35503, 1:300) for 1 hour at RT. Nuclei were counterstained with propidium iodide (1µg/ml with 10µg/ml RNase A, HB0820) for 30 minutes at RT. For more detail please see our ICC protocol. Images were captured using a Leica SPE confocal laser scanning microscope coupled to a Leica DMi8 inverted epifluorescence microscope. The image was captured in Lightning deconvolution mode using a 63x objective with 0.18µm z-spacing, 488nm (1.4% power, 10% gain (HyD)) and 514nm (21.1% power, 146.5% gain (HyD)) lasers. Following capture the stack was flattened using a maximum Z projection in ImageJ (Schindelin et al., 2012. Nat Methods, 9(7), 676–682).
Product information
Immunogen
Full length recombinant human vimentin expressed in and purified from E. coli
Epitope
Amino acids 409 - 425 (SRISLPLPNFSSLNRET)
Clone number
2D1
Isotype
IgG2a
Purification
Protein G affinity chromatography
Concentration
1 mg/ml
Formulation
50% PBS, 50% glycerol plus 5mM sodium azide
Predicted species reactivity
Rat, Human
Tested species reactivity
Rat, Human, Mouse (no staining)
Tested applications
Applications
ICC, WB, IHC(IF)
Western blot optimal concentration
0.2µg/ml (1:5,000) as tested in HEK293T and HeLa cell lysates. We have only been able to succesfully test this antibody in human derived cell lines with animal tissues showing mostly negative results.
IHC(IF) optimal concentration
1µg/ml (1:1000) as tested in 4% PFA fixed rat brain sections
ICC optimal concentration
0.25µg/ml (1:4000) as tested in mixed primary rat neuronal cultures.
Positive control
Vimentin is highly expressed in human cell lines such as HEK293 and HeLa while also being expressed at high levels in glia within the CNS.
Negative control
Vimentin is not expressed in some human derived cell lines such as HepG2 and RT4 cells while in tissue samples vimentin is not expressed in hepatocytes but is in other cell types within the liver.
Vimentin is expressed in tissues with a mesenchymal origin including glia, fibroblasts, endothelial cells lining blood vessels, renal tubular cells and many cells of the immune system amongst others. Vimentin is also expressed in cells undergoing a epithelial-mesenchymal transition therefore used as a marker for this.
Subcellular expression
Vimentin is expressed in the intermediate filaments of the cytoskeleton.
Target function
As a intermediate filament component, vimentin has important roles in anchoring organelles within a cell, providing resilience to mechanical stress and regulating cytoskeletal interactions.
Processing
The initiator methionine is removed to form the mature protein.
Post translational modifications
Subject to phosphorylation on multiple residues alongside posessing sumoylation, N-6 acetylation and N-6 succinylation sites.
Homology (compared to human)
Mouse and rat show 97.4% identity to human Vimentin in a BLAST search.
Similar proteins
The following proteins were identified as being similar to Vimentin in a BLAST search:
Desmin - 62.9% identity
GFAP - 58.1% identity
Peripherin - 57.1% identity
Epitope homology (between species)
In a BLAST search the epitope sequence had the following homology with:
Rat - 94.4% identity
Human - 94.4% identity
Mouse - 88.4%
Chimpanzee - 94.4% identity
Cow - 94.4% identity
Chicken - 66.7% identity
Epitope homology (other proteins)
A BLAST search identified the following proteins as having similarity with the epitope sequence:
Desmin - 61.1% identity, 53.5kDa
Peripherin - 64.3% identity, 53.6kDa
Reelin - 56.3% identity, 388kDa
LY6G5B - 100% identity (matched across only 7 residues, 22.5kDa)
Storage & Handling
Storage instructions
-20°C
Shipping Conditions
On ice
Important
This product is for RESEARCH USE ONLY and is not intended for therapeutic or diagnostic use. Not for human or veterinary use
What guarantee do you have that my Vimentin antibody will perform as expected?
We guarantee that your Vimentin antibody will work for the applications and species we list on the datasheet. If the antibody fails to perform as expected then we are happy to offer a 100% refund guarantee. For more details please see our guarantee policy.
What protocols are available for use with this Vimentin antibody?
We have made a comprehensive collection of protocols that we have used in our experiments to validate this Vimentin antibody.
What counterstains do you recommend for use in ICC and IHC with this Vimentin antibody?
Will my Vimentin antibody work against species that have not been listed on the datasheet?
A species not being listed doesn’t mean that the Vimentin antibody won’t work, just that we haven’t tested it. If you test one of our antibodies in a new species please let us know (positive or negative)!
Monoclonal antibody to Vimentin - class III intermediate filament expressed in mesenchymal cells used as a marker of epithelial-mesenchymal transition. Part of the ValidAb™ range of highly validated, data-rich antibodies.
Antibody to Vimentin - class III intermediate filament expressed in mesenchymal cells used as a marker of epithelial-mesenchymal transition. Part of the ValidAb™ range of highly validated, data-rich antibodies.


 Western Blot Protocol (1 MB)